Visualizing Features and Benefits with Radial Charts
RJ0900019_12
- Last Update 08/21/2025
- File Size 0.3MB
- # of Slides 2
- File Format PPTX
- Slide Ratio 16:9
- Color
Keywords
- #Content-Based Slides
- #Design-Based Slides
- #Product/Service Introduction
- #Diagram
- #Graph
- #Features
- #Benefits and Advantages
- #Cluster
- #Other
- #Closed Cluster Diagram
- #Radar Chart Spider Chart
- #16:9
- #radial chart PowerPoint
- #6-axis diagram slide template
- #features comparison PowerPoint
- #data visualization slide
- #radial chart template download
About the Product
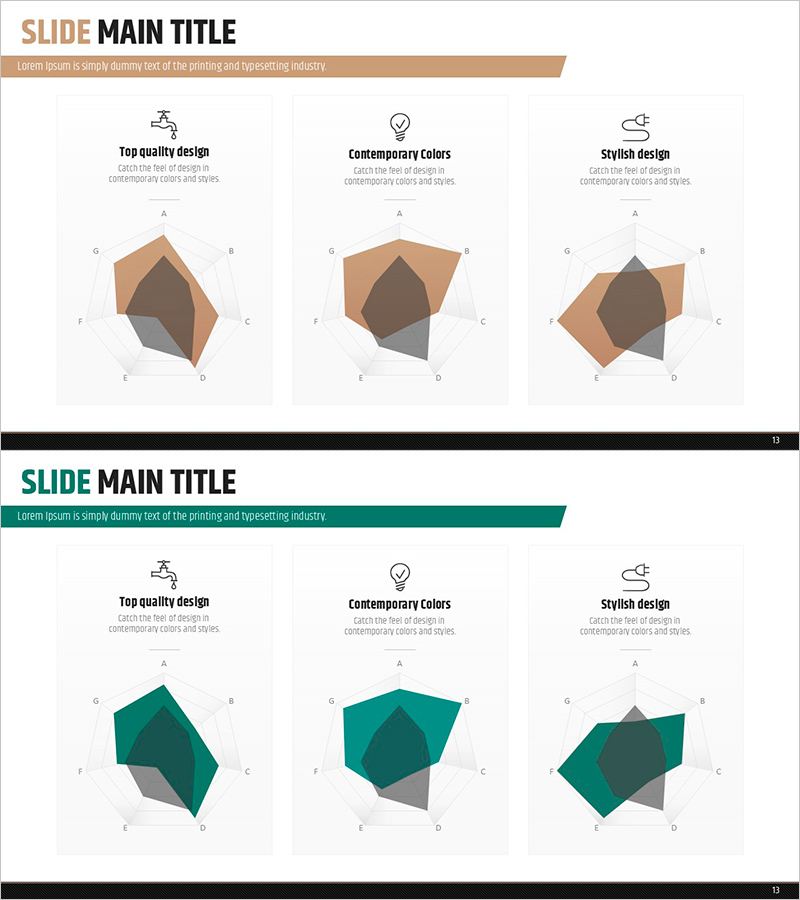
A PowerPoint slide template featuring a 6-axis radial chart for visualizing and comparing product features and benefits across multiple dimensions. Presented in two color schemes—warm tan and teal—with labeled axes (A through F) optimized for comparative analysis. Ideal for product positioning, competitive differentiation, and multi-criteria evaluation in business presentations. The 16:9 widescreen format includes 2 fully editable slides ready for immediate use in your presentation deck.
Usage Points
-
Main Usage
This slide enables simultaneous comparison of multiple product or service attributes, highlighting competitive strengths across six dimensions. Use it to evaluate criteria such as quality, price, performance, reliability, usability, and support—presenting complex comparative data in an intuitive, visually balanced format.
-
How to Use
Replace axis labels (A–F) with your specific feature or benefit names, then adjust the radial polygon size to match your data values. Choose the tan version for a warm, trustworthy tone or the teal version for a modern, professional appearance. Both variants are fully editable in PowerPoint.
-
Recommended For
Product managers, marketing professionals, sales teams, executive presentations, and consulting proposals. Particularly effective for B2B product launches, service differentiation strategies, performance reviews, and stakeholder communications requiring quantitative multi-criteria comparison.
-
Slide Structure
Two-slide set with one 6-axis radial chart per slide. Slide 1 features a warm color palette (beige, tan, gray); Slide 2 uses a teal palette (teal, dark teal, gray). Each chart includes a central hexagonal area, six labeled axes, and gridlines for easy data entry and immediate deployment.
Related Products
-

Food Ingredient Characteristics Radar Chart – Features and Benefits
#Product/Service Introduction #Diagram #Graph
-

Denim PPT Keyword Box
#Product/Service Introduction #Operational Plan #Diagram
-

Visualization of an Efficient Learning Plan – Efficiency and System
#Product/Service Introduction #Diagram #Features
-

Product Features and Differences – Stylish Design
#Product/Service Introduction #Diagram #Features
