Fantastic Wide PPT Radar Chart – Visualizing Product Features and Benefits
RJ0200049_28
- Last Update 04/12/2025
- File Size 0.5MB
- # of Slides 2
- File Format PPTX
- Slide Ratio 16:9
- Color
Keywords
- #Content-Based Slides
- #Design-Based Slides
- #Product/Service Introduction
- #Graph
- #Product/Service Introduction
- #Features
- #Other
- #Radar Chart Spider Chart
- #16:9
- #radar chart PowerPoint
- #6-axis diagram slide
- #product performance comparison PowerPoint
- #multi-axis chart template
- #how to create radar chart in PowerPoint
About the Product
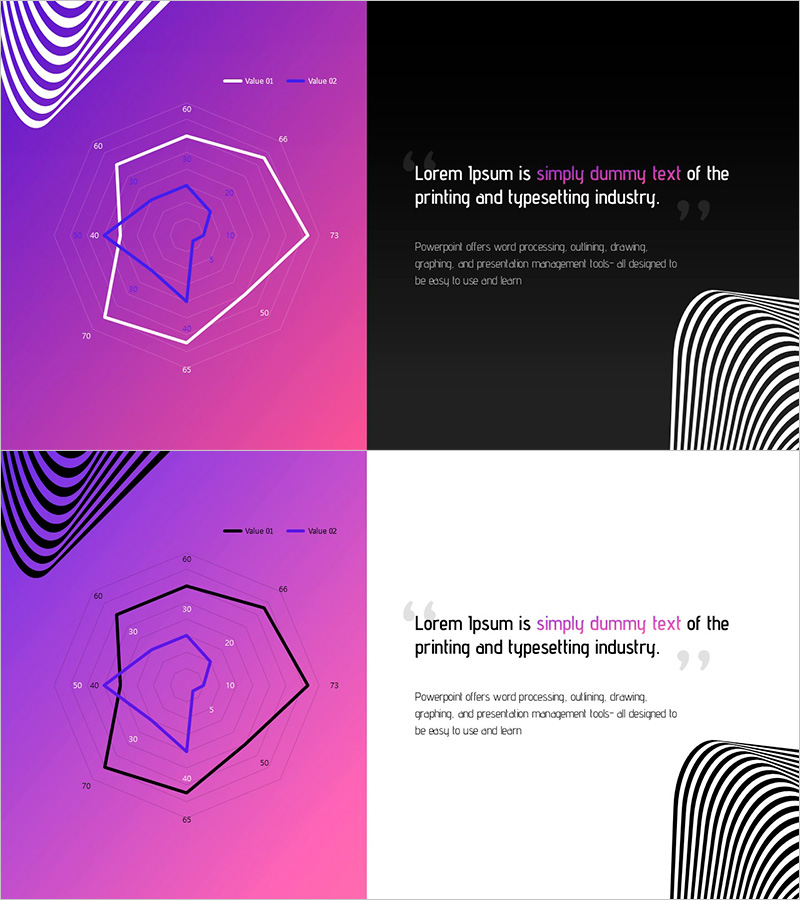
A 6-axis radar chart PowerPoint slide designed to compare multiple product features and performance metrics at a glance. The slide features a purple-to-pink gradient background with white and blue multi-layer hexagonal structures that visualize hierarchical data comparison. Delivered as a 2-slide set with a black background text page, each axis displays numerical labels for quantitative analysis. Ready to use for product introductions, competitive benchmarking, and performance evaluation presentations.
Usage Points
-
Main Usage
Simultaneously compare multiple product attributes (performance, price, quality, reliability, technology, customer satisfaction) and highlight competitive strengths. Ideal for competitive benchmarking, product positioning, and performance evaluation materials.
-
How to Use
Replace axis numerical labels with your product attribute values and differentiate the multi-layer hexagon colors by data series. Add product name and description to the black background text page to complete the 2-slide presentation.
-
Recommended For
Product marketing teams, sales presentations, technical evaluation reports, investor pitch decks, executive briefings, and consulting proposals. Suitable for B2B and B2C presentations requiring quantitative comparison.
-
Slide Structure
Slide 1: Purple-pink gradient background, centered 6-axis radar chart (white outer hexagon, blue inner hexagon, data point connectors), legend at top (Value 01, Value 02), axis labels 0-85. Slide 2: Black background with white striped decoration on right, text area on left (title, body text, quotation mark).
Related Products
-

Application Service Introduction and Features – Organized with Cluster Diagram
#Product/Service Introduction #Diagram #Product/Service Introduction
-

Blue Radar Chart Analysis – Insights for Products and Services
#Product/Service Introduction #Graph #Features
-

Real Estate Analysis Charts by Consumer Characteristics – Graphs for Market Insights
#Product/Service Introduction #Market and Competitor Analysis #Graph
-

Modern Business Presentation Template Circle Diagram – Product/Service Introduction
#Product/Service Introduction #Diagram #Product/Service Introduction
