Illustration Bell Graph – Performance and Business Strategy
RJ0800001_15
- Last Update 07/30/2025
- File Size 0.4MB
- # of Slides 2
- File Format PPTX
- Slide Ratio 16:9
- Color
Keywords
About the Product
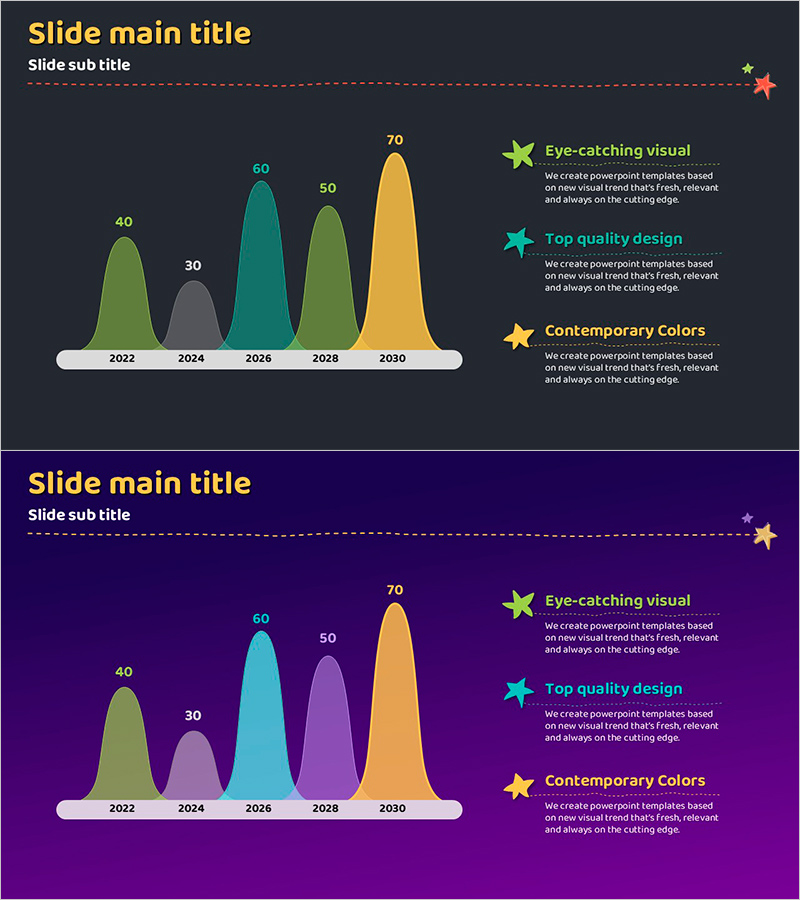
A PowerPoint slide that visualizes performance trends from 2022 to 2030 using a bell curve chart. The design features a dark background with soft gradient curves in green, teal, and yellow tones, clearly displaying year-by-year data points (30–70). Three key messaging points are positioned on the right side with star icons for emphasis. This slide deck is ready to use for business performance analysis presentations, strategic planning sessions, marketing performance reports, and executive briefings.
Usage Points
-
Main Usage
Display year-over-year performance changes, illustrate phased business strategy progression, and showcase marketing performance trends. The bell curve format highlights peak performance periods and overall trajectory at a glance.
-
How to Use
Input your actual data into the bell curve chart on the left side of the slide, then customize the three key messaging points on the right to match your presentation content. The dark background and colored curves provide strong contrast for clear visibility in projector environments.
-
Recommended For
Executive performance reports, business results analysis presentations, marketing campaign outcome briefings, financial performance explanations, strategic planning meetings, and investor presentations requiring data-driven professional communication.
-
Slide Structure
Two-slide layout. First slide features a dark gray background with a 5-year bell curve graph (2022–2030) and three right-aligned messaging points (Eye-catching visual, Top quality design, Contemporary Colors). Second slide presents the identical structure with a deep purple background, offering color variation options.
Related Products
-

Investigating Specific Ranges in Scientific Line Graphs – Performance and Competitor Analysis
#Business Strategy #Market and Competitor Analysis #Graph
-

Visualizing Awards and Achievements in PowerPoint – Outstanding Presentation Design
#Company Introduction #Business Strategy #Other
-

Highlighting Key Data Points in Trends – Performance and Vision
#Business Strategy #Financial Plans and Performance #Graph
-

Slanted Horizontal Bar Graph – Visual Tool for Business Strategy
#Business Strategy #Market and Competitor Analysis #Graph
