Key Strategy Presentation and Execution Roadmap – Journey to Success
RJ0700031_4
- Last Update 11/04/2025
- File Size 15.2MB
- # of Slides 2
- File Format PPTX
- Slide Ratio 16:9
- Color
Keywords
About the Product
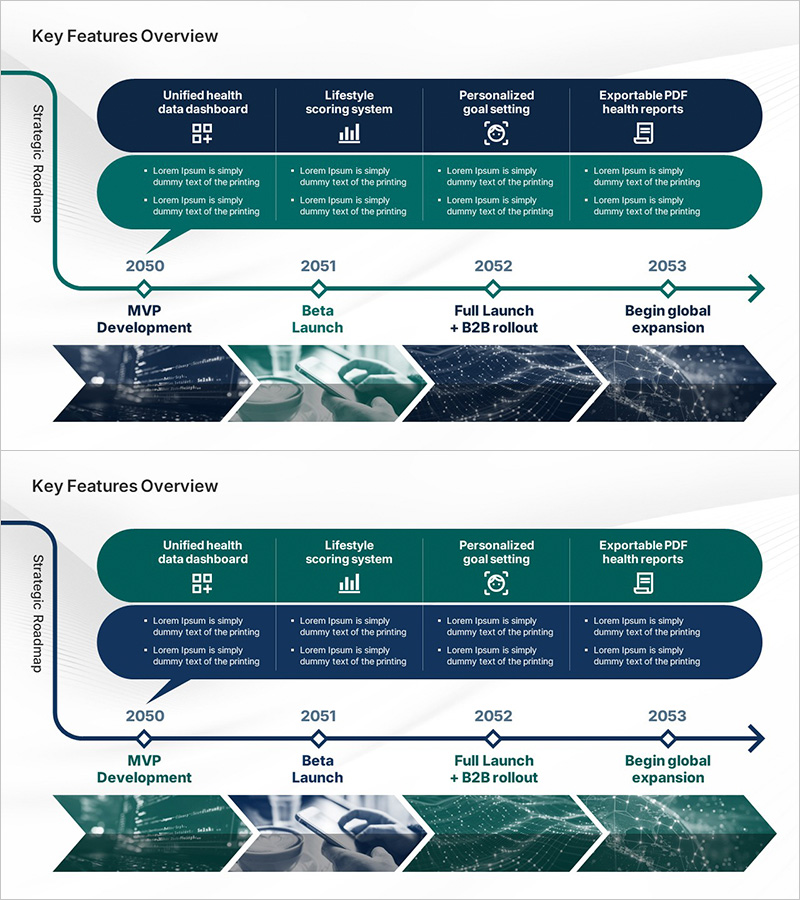
A 4-stage linear roadmap PowerPoint slide that visualizes strategic execution across key milestones and deliverables. The dark navy top section displays four core features (Unified health data dashboard, Lifestyle scoring system, Personalized goal setting, Exportable PDF health reports) with icons and descriptions, while the teal bottom section provides detailed bullet-point explanations for each phase. A year-by-year timeline (2050 MVP Development, 2051 Beta Launch, 2052 Full Launch + B2B rollout, 2053 Begin global expansion) with connecting arrows and progress imagery illustrates project advancement. Delivered as a 16:9 PPTX file with 2 fully editable slides for immediate use in presentations.
Usage Points
-
Main Usage
Present product launch strategies, project execution roadmaps, and multi-year strategic plans in a clear chronological flow. Combines key deliverables with timeline milestones to communicate overall project direction and phased implementation to stakeholders.
-
How to Use
Insert into business plans, investor pitch decks, and strategic reports in the execution roadmap section. Customize the top feature boxes with your project's core deliverables and descriptions, adjust the timeline years and milestones to match your schedule, and replace placeholder images with project-specific visuals.
-
Recommended For
Product managers, business development teams, C-suite executives preparing strategic presentations, venture capital pitch teams, and management consultants. Ideal for technology companies, startups, healthcare enterprises, and organizations presenting long-term strategic initiatives and phased rollout plans.
-
Slide Structure
Two-section layout: top section features 4 feature boxes (icon + title + 3-line bullet descriptions) in dark navy; bottom section displays 4-stage timeline (year + milestone label + progress imagery) in teal. Color contrast emphasizes information hierarchy, while connecting arrows highlight sequential progression.
Related Products
-

Effectiveness Analysis Plan Diagram
#Business Management #Operational Plan #Diagram
-

Timeline Chart Visualizing Yearly Changes – Journey of Success
#Company Introduction #Operational Plan #Diagram
-

Surgery Schedule by Body Part Diagram
#Business Strategy #Operational Plan #Diagram
-

Marketing Effectiveness Analysis Flow Diagram - Business Execution Plans
#Business Management #Operational Plan #Diagram
