Effectiveness Analysis Plan Arrow Diagram
RM0400001_32
- Last Update 02/14/2025
- File Size 0.4MB
- # of Slides 2
- File Format PPTX
- Slide Ratio 16:9
- Color
Keywords
- #Content-Based Slides
- #Design-Based Slides
- #Business Management
- #Operational Plan
- #Diagram
- #Implementation Schedule
- #Project Implementation Schedule
- #Flow
- #Structure
- #Linear Flow
- #Pyramid Chart
- #16:9
- #arrow diagram PowerPoint
- #3-step flow chart
- #effectiveness analysis slide
- #process flow diagram
- #operational planning PPT slide template
About the Product
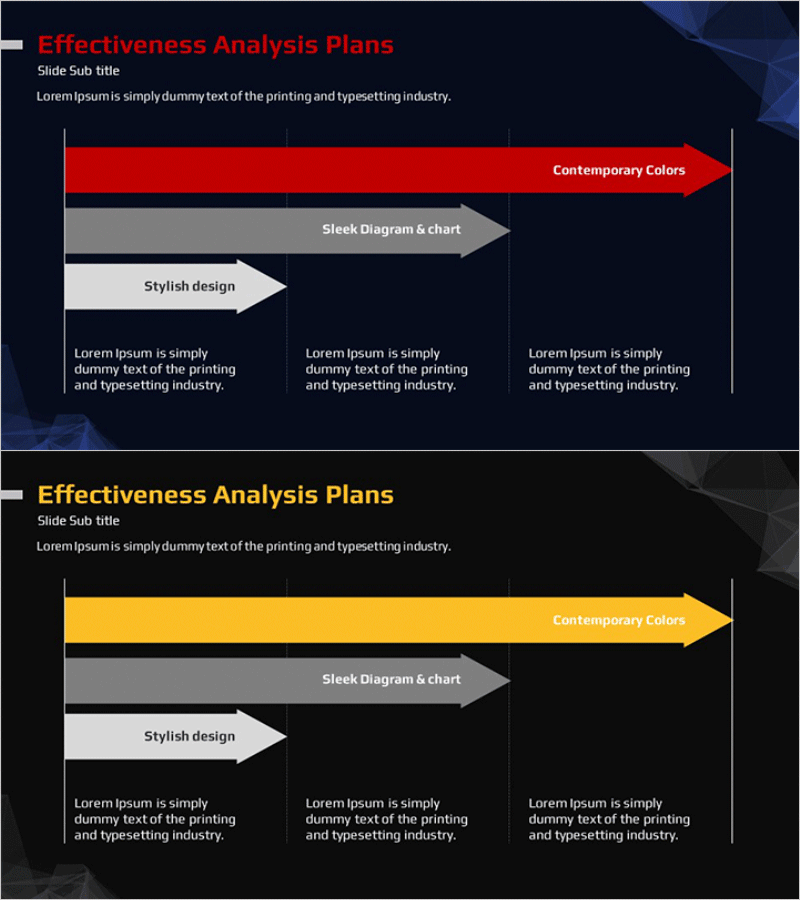
A 3-step arrow diagram PowerPoint slide designed to visualize effectiveness analysis plans and operational processes in a sequential flow. The slide features a red, gray, and white dual-tone color scheme with left-to-right arrow progression, clearly representing process stages and strategic phases. Each arrow box includes dedicated title and description text areas for flexible content input. This 2-slide set provides both color and monochrome versions in 16:9 widescreen PPTX format, fully editable in all PowerPoint versions. Ideal for business plans, operational planning, project management, and effectiveness analysis presentations.
Usage Points
-
Main Usage
Visualize effectiveness analysis plans, operational processes, and business implementation stages through a left-to-right linear flow structure. Enables audiences to intuitively understand step-by-step progression and strategic decision-making processes by clearly presenting each phase's key content in arrow boxes.
-
How to Use
Use in business plans, operational planning presentations, and effectiveness analysis reports within strategy, implementation strategy, and business management sections. Input stage names (e.g., Current Analysis, Strategy Development, Execution) in the title area and detailed descriptions in the text area below for immediate presentation use.
-
Recommended For
Recommended for executives, business managers, operations teams, consultants, and marketing professionals requiring process-based presentations. Particularly effective for business plans, operational planning, effectiveness analysis, and improvement proposals that emphasize sequential progression.
-
Slide Structure
Comprises 3 horizontal arrow boxes, each containing a title input area (top) and description text area (bottom). Slide 1 features red, gray, and white dual-tone color version; Slide 2 provides monochrome version for adaptability across various presentation environments.
Related Products
-

Business Progress Schedule Arrow Diagram – A Clear Start for Strategy
#Business Management #Operational Plan #Diagram
-

Effectiveness Analysis Plan Diagram
#Business Management #Operational Plan #Diagram
-

Icon Box Roadmap Slide – Three-Stage Milestone PowerPoint
#Business Strategy #Business Management #Operational Plan
-

Business Process STEP 5 Diagram – Efficient Operational Planning
#Business Strategy #Operational Plan #Diagram
