Flow Diagram with Objectives – Strategy and Direction
RB0100045_7
- Last Update 03/06/2025
- File Size 0.3MB
- # of Slides 2
- File Format PPTX
- Slide Ratio 4:3
- Color
Keywords
- #Content-Based Slides
- #Design-Based Slides
- #Business Vision and Strategy
- #Business Strategy
- #Diagram
- #Business Goals
- #Business Direction
- #Flow
- #Cluster
- #Linear Flow
- #Chain Diagram
- #4:3
- #circular flow diagram PowerPoint
- #4-step cycle diagram presentation
- #business process diagram slide
- #strategy flowchart PPT template
- #business objective visualization slide
About the Product
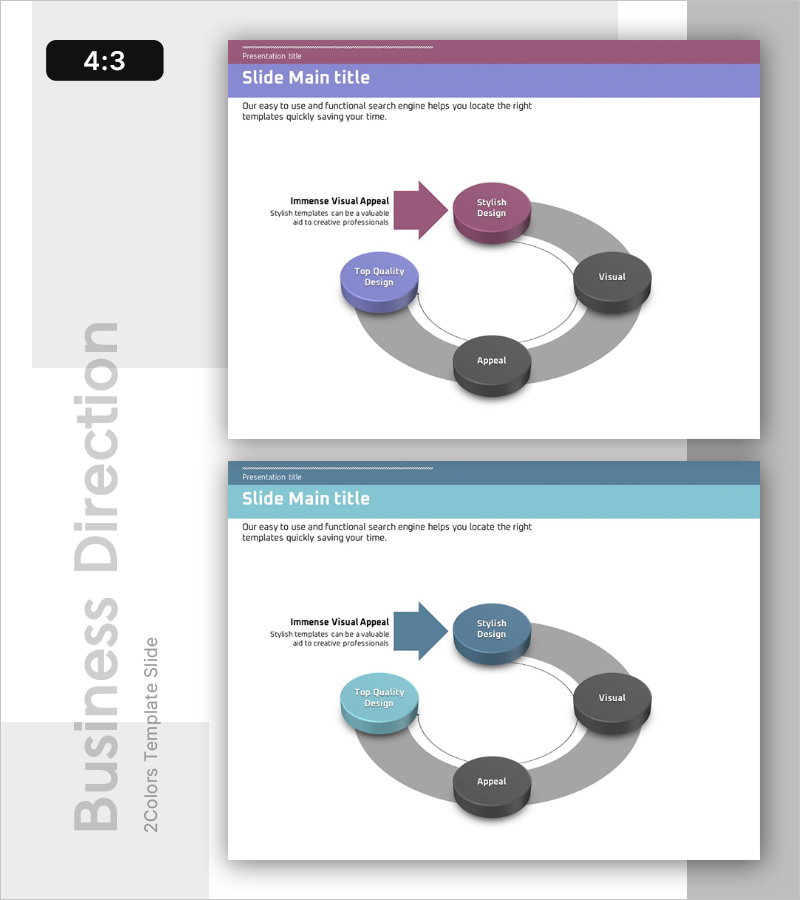
A 4-step circular flow diagram PowerPoint slide that visualizes business strategy and implementation direction. Purple, blue, and gray 3D spherical nodes connected by arrows clearly express the cyclical structure. Each node accommodates key elements such as 'Stylish Design', 'Visual Appeal', 'Top Quality Design', and 'Appeal' to emphasize the phased flow of business objectives. The 2-slide set provides color variations (purple and blue tones) and is compatible with all presentation environments in 4:3 aspect ratio. Fully editable PPTX format allows you to customize text, colors, and node placement freely.
Usage Points
-
Main Usage
Optimized for visually communicating phased processes when establishing business strategies and setting implementation directions. Ideal for executive reports, strategy presentations, and business plan presentations to clearly explain the cyclical structure of goal achievement.
-
How to Use
Open the slide and replace each node's text with your strategy stages. Adjust colors or add/remove nodes to match your organization's process. During presentation, follow the arrow direction to explain the circular flow, which increases audience comprehension.
-
Recommended For
Executives, strategy managers, project managers, marketing planners, and organizational development specialists can use this when explaining business objectives, vision realization pathways, operational cycles, and performance management systems.
-
Slide Structure
Four 3D spherical nodes arranged in a circle and connected by arrows in a cyclical pattern. Each node has an independent text input area, with a gray background circle in the center emphasizing the overall flow. The 2-slide set provides color variations in purple and blue tones.
Related Products
-

Speech Connection Diagram – Vision and Strategy
#Business Vision and Strategy #Business Strategy #Diagram
-

Infographic Slide for Carbon Neutral Service Contents
#Business Vision and Strategy #Business Strategy #Diagram
-

Key Outcomes from Experimentation – Vision and Strategy
#Business Vision and Strategy #Diagram #Business Goals
-

Travel guide business step-by-step itinerary planning connection diagram
#Business Strategy #Diagram #Step-by-Step Schedule Plan
