White Black Broken Line Graph – Best for Market Analysis
RJ0700027_8
- Last Update 07/30/2025
- File Size 0.3MB
- # of Slides 2
- File Format PPTX
- Slide Ratio 16:9
- Color
Keywords
- #Content-Based Slides
- #Design-Based Slides
- #Market and Competitor Analysis
- #Graph
- #Competitor Analysis
- #Market Analysis
- #Line
- #Line Chart
- #16:9
- #line chart PowerPoint
- #market trend analysis slide
- #3-series line graph
- #competitive analysis PPT
- #time series data visualization
- #business presentation template
About the Product
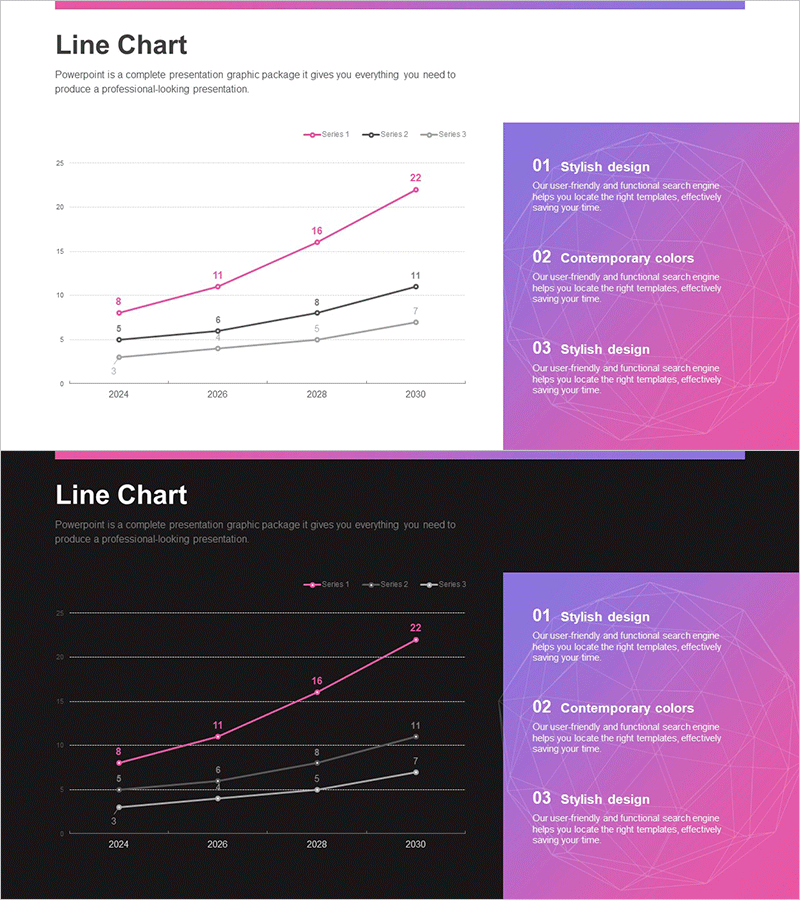
A line chart PowerPoint slide comparing three data series from 2024 to 2030, ideal for market trend analysis and competitive benchmarking. Available in both white and black background versions, with pink, black, and gray line colors clearly distinguishing each data series. Data point values (8→11→16→22, etc.) are directly labeled on the chart for immediate readability. This presentation template is ready to insert into business reports, market analysis decks, and strategic planning documents. Fully editable PPTX format with 16:9 aspect ratio.
Usage Points
-
Main Usage
Visualize changes in data over time across three different metrics or competitors simultaneously. Perfect for displaying market growth rates, sales performance trends, customer satisfaction evolution, or competitive market share changes from 2024 to 2030.
-
How to Use
Use the white background version for printed reports and formal documents; use the black background version for digital presentations and projector displays. Edit the legend labels and axis titles to match your data, then input your values. The chart automatically updates with your numbers.
-
Recommended For
Marketing professionals presenting market analysis, sales teams reporting quarterly performance, executives reviewing strategic trends, consultants preparing proposal decks, and researchers presenting longitudinal data. Ideal for any business presentation requiring year-over-year or period-over-period comparisons.
-
Slide Structure
2-slide deck with identical layouts. Each slide features a line chart with 4 time points (2024, 2026, 2028, 2030) on the X-axis and a 0-25 scale on the Y-axis. Three data series are represented by distinct colored lines (pink, black, gray) with labeled data points. A description box with three numbered items appears on the right side of each slide.
Related Products
-

Market Trend Analysis Graph – Visualizing Market Status
#Market and Competitor Analysis #Diagram #Graph
-

Competitor Analysis Broken Line Graph
#Market and Competitor Analysis #Graph #Competitor Analysis
-

Sales and Profit Analysis Graph – Market Trends and Forecast
#Market and Competitor Analysis #Diagram #Graph
-

Competitor Analysis PC Mockup Graph – Market Trends and Insights
#Market and Competitor Analysis #Graph #Other
