Competitor Analysis Broken Line Graph – Market Insights Provided
RJ0700006_26
- Last Update 07/23/2025
- File Size 2.5MB
- # of Slides 2
- File Format PPTX
- Slide Ratio 16:9
- Color
Keywords
About the Product
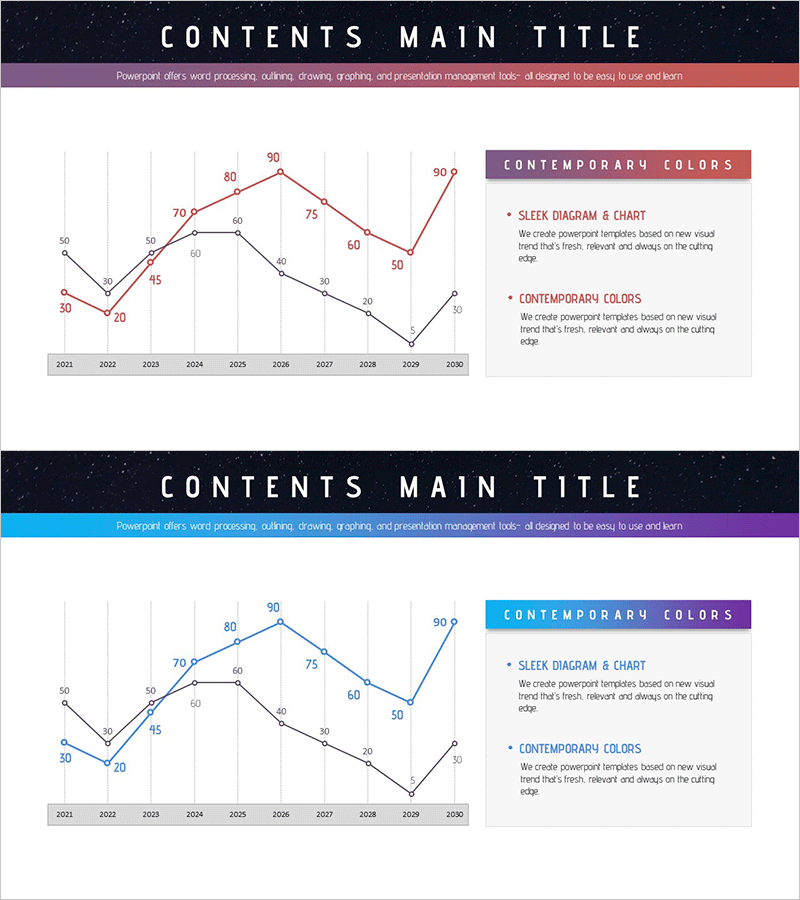
A 2-slide line chart PowerPoint template designed for competitor analysis and market insight visualization. The chart displays data trends from 2021 to 2030 using two distinct series represented in purple and red lines, enabling clear comparison of divergent trends. The dual Y-axis configuration (left axis: 20–90, right axis: 0–90.9) allows independent scaling for datasets with different units. The second slide features a contemporary color palette text box to reinforce presentation context. Delivered in 16:9 widescreen PPTX format, fully editable and ready for business reports, marketing analysis, financial presentations, and strategic performance reviews.
Usage Points
-
Main Usage
Ideal for comparing competitor performance against company metrics over time, or visualizing market indicators from two perspectives simultaneously. The dual Y-axis feature enables effective representation of datasets with different units (e.g., revenue and market share) on a single chart, supporting data-driven decision-making.
-
How to Use
Replace the data points and line colors in the left slide with your own dataset, and input analysis findings or insights into the text box on the right slide. Update the X-axis with year values, adjust Y-axis ranges to match your data scale, modify the legend and title, and the slide is ready for presentation.
-
Recommended For
Executive reports, quarterly performance presentations, competitive analysis briefings, marketing performance reviews, financial status updates, market research findings, and strategy planning sessions. Recommended for executives, marketing managers, financial analysts, and strategic planners who need to communicate data-driven insights.
-
Slide Structure
2-slide layout. Left slide features a line chart displaying 10-year data (2021–2030) with 2 series in purple and red, using dual independent Y-axes for different data scales. Right slide includes a contemporary color palette explanation text box paired with analysis content, creating a balanced information presentation.
Related Products
-

Black Navy Broken Line Graph Table – Market and Competitor Analysis
#Market and Competitor Analysis #Diagram #Graph
-

Competitor Analysis Broken Line Graph
#Market and Competitor Analysis #Graph #Competitor Analysis
-

Project Market Environment Analysis Chart – Powerful Competitive Strategy
#Market and Competitor Analysis #Graph #Competitor Analysis
-

Line Graph and Clustered Column Graph – Essential for Competitor Analysis
#Market and Competitor Analysis #Graph #Competitor Analysis
