Visualizing Profit & Loss with Reverse Table Chart
RJ0700027_22
- Last Update 07/29/2025
- File Size 0.3MB
- # of Slides 2
- File Format PPTX
- Slide Ratio 16:9
- Color
Keywords
- #Content-Based Slides
- #Design-Based Slides
- #Financial Plans and Performance
- #Diagram
- #Income Statement
- #Key Financial Indicators
- #Table
- #16:9
- #profit and loss table PowerPoint slide
- #financial data visualization PPT
- #reverse table chart design
- #how to present financial statements in PowerPoint
- #financial comparison slide template
About the Product
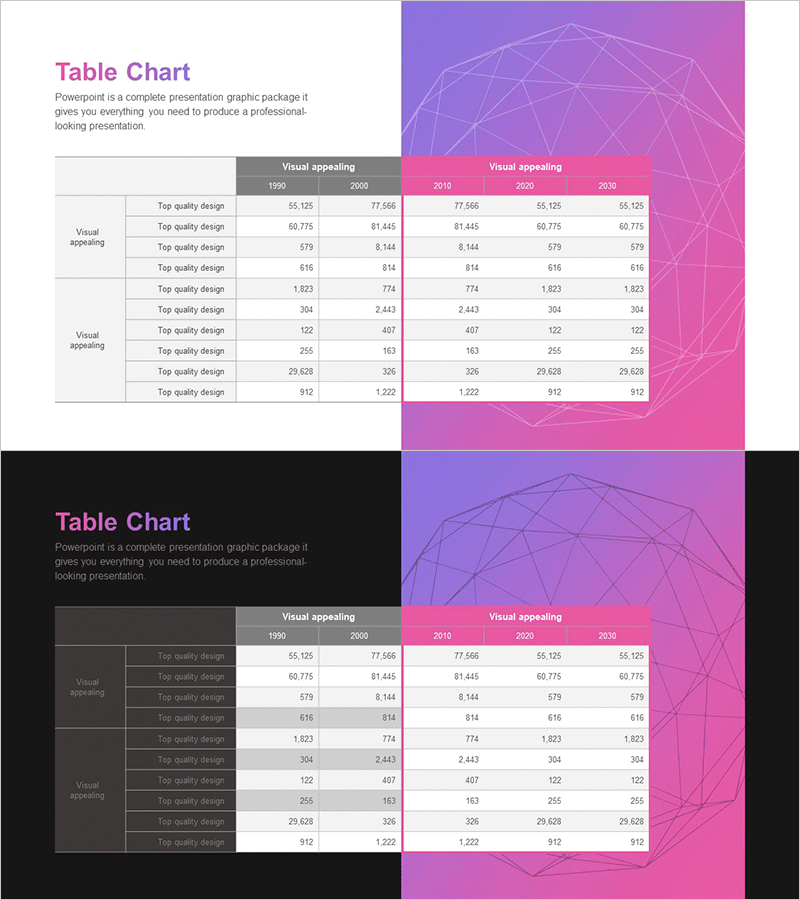
A financial data visualization PowerPoint slide featuring a reverse table chart design for presenting profit and loss statements, financial metrics, and comparative data analysis. Two design versions combine magenta and gray backgrounds with structured table layouts to display multi-year and multi-category financial information at a glance. The dual-column comparison format makes year-over-year trends and key financial indicators immediately recognizable. Ready-to-use for investor presentations, IR materials, financial reports, and executive briefings.
Usage Points
-
Main Usage
Present financial performance and P&L statements with clarity and credibility to investors, stakeholders, and executives. The reverse table layout with color-coded backgrounds emphasizes key metrics and enables instant recognition of financial trends, while multi-column comparison structure supports objective performance validation.
-
How to Use
Insert into IR decks, financial reports, investor presentations, and quarterly earnings briefings. Replace sample data with actual P&L figures, budget allocations, and financial ratios. Choose between magenta or gray version based on corporate branding guidelines and presentation context.
-
Recommended For
CFOs, financial analysts, investor relations teams, startup founders preparing pitch decks, public company executives presenting quarterly results, and finance professionals creating loan applications or financial forecasts.
-
Slide Structure
2-slide set with title and description area at top, multi-row table (10-12 rows, 3-5 columns) at bottom. Magenta version features geometric background graphics on the right; gray version uses dark background for enhanced numerical readability. All table cells are fully editable for custom data entry.
Related Products
-

Income Statement Table – Clearly Presenting Financial Plans and Performance
#Financial Plans and Performance #Diagram #Income Statement
-

Robot Business Revenue and Sales Analysis Table – A Systematic Approach to Financial Planning
#Financial Plans and Performance #Diagram #Income Statement
-

Income Statement Table – Clearly Presenting Financial Plans and Performance
#Financial Plans and Performance #Diagram #Income Statement
-

Fire Department Work Table – Visualizing Financial Plans and Performance
#Financial Plans and Performance #Diagram #Income Statement
