Income Statement Table – Visualizing Financial Performance
RJ0300023_27
- Last Update 04/24/2025
- File Size 0.3MB
- # of Slides 2
- File Format PPTX
- Slide Ratio 16:9
- Color
Keywords
- #Content-Based Slides
- #Design-Based Slides
- #Financial Plans and Performance
- #Diagram
- #Income Statement
- #Key Financial Indicators
- #Table
- #16:9
- #income statement PowerPoint slide
- #financial table design
- #profit and loss table PPT
- #financial data visualization slide
- #how to create income statement in PowerPoint
About the Product
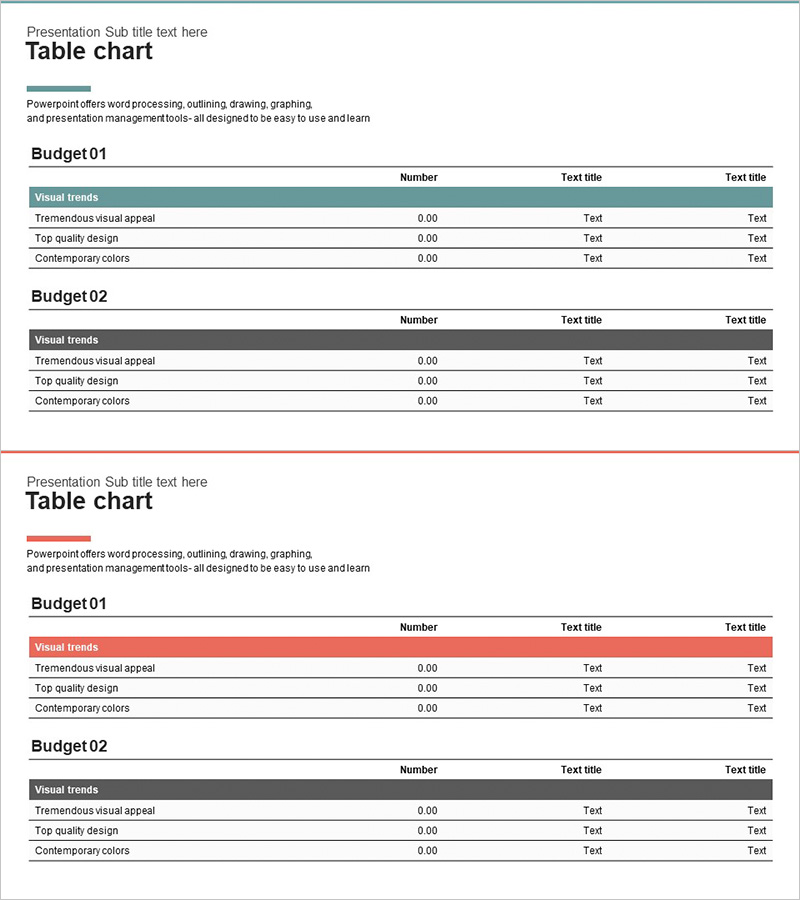
A financial data table PowerPoint slide designed to clearly present income statement performance and profit-and-loss metrics. Provided in two color versions (teal and red), each featuring a 3-column structure (Item, Number, Text Title) with 4 data rows. The table layout is ideal for IR presentations, financial reports, and investor briefings, allowing you to input actual financial figures directly into editable cells. The color-coded header row emphasizes information hierarchy, making complex financial data easy to scan and understand at a glance.
Usage Points
-
Main Usage
This slide clearly communicates financial performance and profit-and-loss status in table format. Revenue, expenses, and net income figures are organized by row, with period-by-period or category-by-category comparisons displayed in columns. It serves as a key tool for demonstrating financial credibility to investors, executives, and stakeholders.
-
How to Use
Input actual financial figures (revenue, cost of goods sold, operating income, net income, etc.) into each cell. The header row color (teal or red) can be customized to match your brand identity, and rows or columns can be added to accommodate additional data. Insert into the financial section of annual reports, business plans, or investor presentations to support data-driven decision-making.
-
Recommended For
CFOs, finance managers, and executives presenting financial performance will find this slide essential. It is particularly effective for investor presentations, shareholder meetings, bank loan applications, and corporate disclosures. Startup pitch decks, financial consulting reports, and quarterly earnings briefings also benefit from this structured table format.
-
Slide Structure
Each slide contains a title area and a table area. The table consists of a color-coded header row followed by 3–4 data rows, with each cell as an independent editable text field. The two slides share identical structure but differ in header color (teal vs. red), allowing you to select the version that best fits your presentation context.
Related Products
-

Income Statement Table – Clearly Presenting Financial Plans and Performance
#Financial Plans and Performance #Diagram #Income Statement
-

Income Statement Table – Clearly Presenting Financial Plans and Performance
#Financial Plans and Performance #Diagram #Income Statement
-

Income Statement Table Slide – Clear Financial Analysis
#Financial Plans and Performance #Diagram #Income Statement
-

Key Financial Indicators Table – Trust and Professionalism
#Financial Plans and Performance #Diagram #Income Statement
