Year-by-Year Analysis Graph & Business Strategy – Market Trends and Growth
RJ0400057_19
- Last Update 06/02/2025
- File Size 0.1MB
- # of Slides 2
- File Format PPTX
- Slide Ratio 16:9
- Color
Keywords
- #Content-Based Slides
- #Design-Based Slides
- #Business Vision and Strategy
- #Market and Competitor Analysis
- #Graph
- #Business Strategy
- #Market Analysis
- #Column
- #Segmented Column
- #16:9
- #stacked bar chart PowerPoint
- #year-over-year analysis slide
- #4-year trend visualization
- #business strategy graph
- #data visualization presentation
- #market analysis PowerPoint template
About the Product
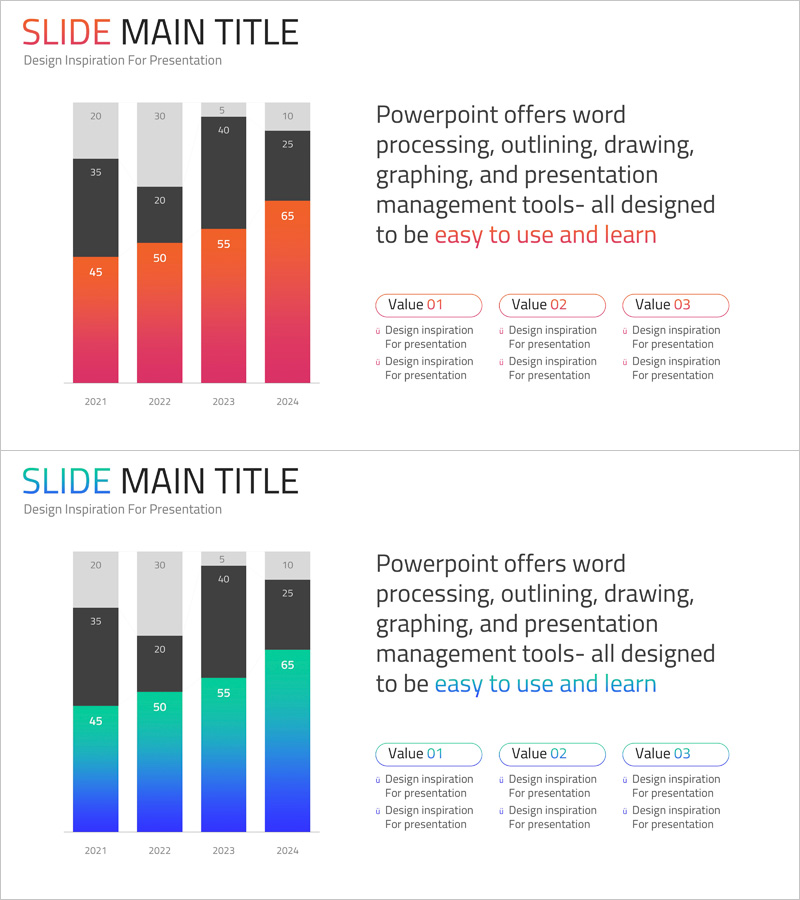
A stacked bar chart PowerPoint slide visualizing year-over-year data trends from 2021 to 2024 across four data series. The gradient color scheme transitions from orange to pink, emphasizing growth momentum and data progression. Three oval-shaped callout boxes on the right highlight key insights and strategic points, making this slide ideal for business strategy presentations, market analysis reports, and investor pitches. Delivered as 2 slides in 16:9 widescreen format (PPTX).
Usage Points
-
Main Usage
Compares time-series data such as annual revenue, growth rates, or market share across four years using four stacked data series. The gradient color progression visually communicates growth trajectory, making it ideal for presenting business performance and strategic forecasts in executive presentations.
-
How to Use
Replace the bar heights and color series with your actual data values for each year. Edit the three oval callout boxes on the right to include key insights, growth drivers, or strategic recommendations. Perfect for quarterly business reviews, annual reports, pitch decks, and market analysis sections of business proposals.
-
Recommended For
Executives, business analysts, and marketing teams presenting quarterly or annual performance reviews, growth metrics, and strategic initiatives. Particularly effective for investor relations presentations, business proposals, and management reports where data credibility and trend visualization are critical.
-
Slide Structure
Left side features a stacked bar chart with 4 years (2021–2024) and 4 data series (gray, black, orange, pink gradient). Right side displays a title and three oval-shaped value boxes (Value 01, 02, 03) for key points. 2 slides in 16:9 aspect ratio.
Related Products
-

3D Segmented Bar Graph for Performance Analysis – Market Trends
#Market and Competitor Analysis #Graph #Customer Analysis
-

Fintech Market Analysis Bar Graph – Clear Data Visualization
#Market and Competitor Analysis #Diagram #Graph
-

Orange Purple Subdivided Graph Table – Visualizing Market Data
#Market and Competitor Analysis #Diagram #Graph
-

Visualizing the Changing Trend of the Ageing Population with a 100% Stacked Bar Graph
#Business Strategy #Market and Competitor Analysis #Marketing Plan and Strategy
