Solar System Pie Graph – Stylish Presentation Design
RJ0700024_8
- Last Update 07/29/2025
- File Size 3.1MB
- # of Slides 2
- File Format PPTX
- Slide Ratio 16:9
- Color
Keywords
- #Content-Based Slides
- #Design-Based Slides
- #Business Introduction
- #Market and Competitor Analysis
- #Graph
- #Technological Status
- #Competitive Advantage
- #Circles
- #Doughnut Chart
- #16:9
- #donut pie chart PowerPoint
- #pie graph slide template
- #3-segment data visualization
- #solar system presentation
- #data visualization slides
- #circular chart PowerPoint download
About the Product
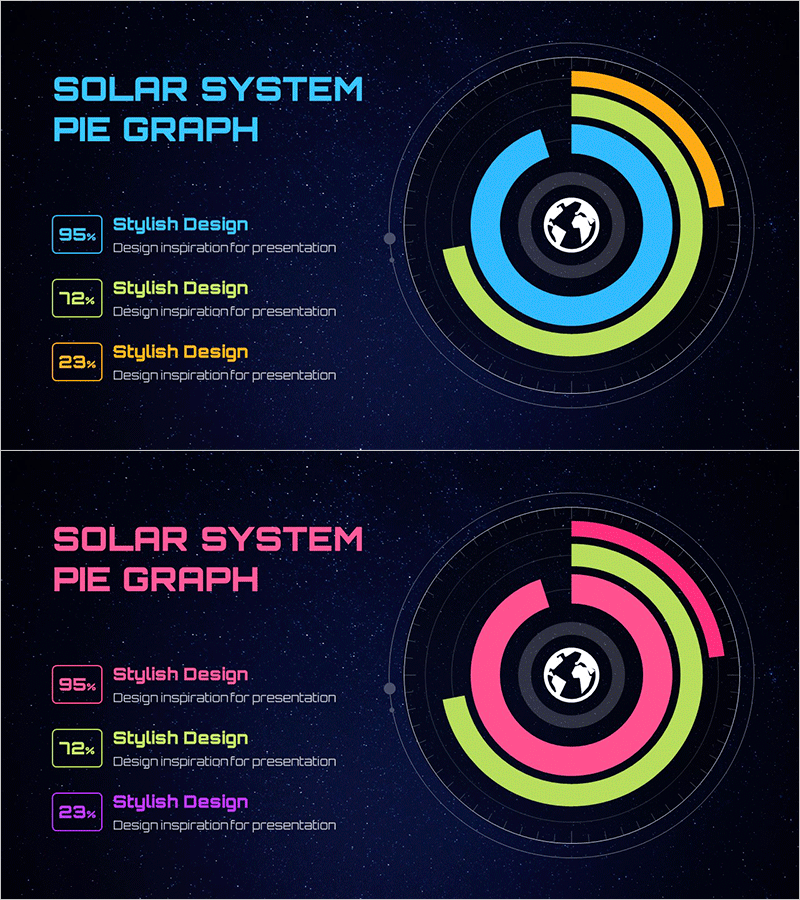
A donut-shaped pie chart PowerPoint slide inspired by the solar system theme. Features a dark navy background with concentric rings in cyan, lime, and gold colors to visualize data proportions. A globe icon is centered to suit global, environmental, and space-themed presentations. Each segment displays percentage values and descriptive text fields for easy customization. Includes 2 slide layouts in 16:9 widescreen PPTX format, ready for immediate editing and data input.
Usage Points
-
Main Usage
Visualize global market share, environmental statistics, or space-related data across 3 segments using a donut-shaped structure. The centered globe icon emphasizes core information, while distinct color segments clarify data differentiation. Perfect for presenting proportional data with visual impact.
-
How to Use
Double-click percentage text and description fields to replace with your data. Modify colors using the theme color palette, and swap the center globe icon with your company logo or custom image. Apply directly to space, environmental, or global business presentations.
-
Recommended For
Environmental reports, sustainability presentations, space and science education materials, global business status updates, marketing market analysis, energy and climate-related presentations. Effective for executive, investor, student, and scientific audiences.
-
Slide Structure
2-slide set. Slide 1: Dark navy background with cyan, lime, and gold concentric donut rings, centered globe icon, left legend showing 95%, 12%, 23% segments. Slide 2: Identical structure with pink and lime color variant. Both slides in 16:9 widescreen format.
Related Products
-

Data Analysis Donut Circle Graph – Visual Representation for Market and Competitive Analysis
#Business Introduction #Market and Competitor Analysis #Graph
-

Comparative Competition Donut Chart – Market and Competitor Analysis
#Market and Competitor Analysis #Graph #Market Status
-

Global Logistics Competitor Chart
#Market and Competitor Analysis #Diagram #Graph
-

Core Transport Competitiveness Analysis – Intuitive Visualization with Graphs
#Market and Competitor Analysis #Graph #Competitor Analysis
