Donut Chart of Credit Card Spending Categories – Market Insights
RB0100050_6
- Last Update 03/06/2025
- File Size 0.3MB
- # of Slides 2
- File Format PPTX
- Slide Ratio 4:3
- Color
Keywords
- #Content-Based Slides
- #Design-Based Slides
- #Market and Competitor Analysis
- #Graph
- #Market Status
- #Competitive Advantage
- #Circles
- #Doughnut Chart
- #4:3
- #donut chart PowerPoint slide
- #pie chart template
- #ratio analysis presentation
- #4-layer donut diagram
- #data visualization slides
- #percentage distribution chart
About the Product
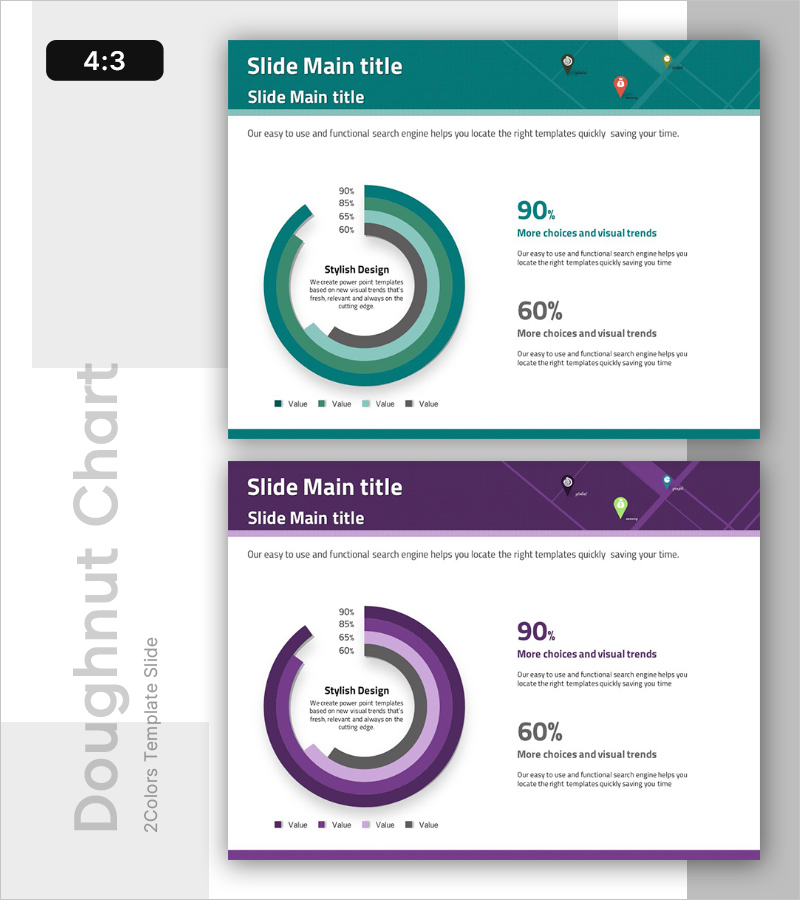
A professional donut chart PowerPoint slide for visualizing credit card spending categories and distribution ratios. The design features a 4-layer concentric donut structure with percentage values (90%, 85%, 65%, 60%) displayed across gradient purple tones. The center circle provides space for key messaging or title text, while the legend clearly identifies each data segment. This slide template is ready for immediate use in market analysis presentations, expense structure comparisons, customer preference surveys, and financial reporting.
Usage Points
-
Main Usage
Displays composition ratios such as spending categories, market share, customer preference distribution, and budget allocation. The center text area emphasizes key messages or titles, while the four-layer percentage values (90%, 85%, 65%, 60%) ensure accurate data communication and visual hierarchy.
-
How to Use
Ideal for business reports, marketing analysis, financial presentations, and market research findings. Customize each layer's color and percentage values to match your data, edit legend labels for different ratio scenarios, and adjust center text to highlight key insights or conclusions.
-
Recommended For
Finance teams analyzing expense structures, marketing teams comparing channel performance, sales teams reviewing customer composition, and executives presenting market overview reports. Recommended for any presentation requiring clear ratio-based data visualization and professional appearance.
-
Slide Structure
2-slide set. First slide features a teal-background donut chart with 4 concentric layers (90%-60% range). Second slide presents the same structure with purple background. Each slide includes title area at top, centered donut diagram, right-side text area for numerical descriptions, and bottom legend with color-coded segments.
Related Products
-

Natural Recreation Area Preference Chart – Market Status Analysis
#Market and Competitor Analysis #Diagram #Graph
-

Comparative Donut Charts by Data Type – Market Status and Competitive Advantage
#Market and Competitor Analysis #Graph #Market Status
-

Comparative Competition Donut Chart – Market and Competitor Analysis
#Market and Competitor Analysis #Graph #Market Status
-

Current Network Deployment by Region – Donut Chart Visualization
#Market and Competitor Analysis #Graph #Market Status
