Stylish Design for Data Visualization – Contemporary Feel and Quality
RJ0700024_6
- Last Update 07/29/2025
- File Size 3.6MB
- # of Slides 2
- File Format PPTX
- Slide Ratio 16:9
Keywords
- #Design-Based Slides
- #Product/Service Introduction
- #Market and Competitor Analysis
- #Graph
- #Development Status
- #Market Share
- #Circles
- #Doughnut Chart
- #16:9
- #donut chart PowerPoint slide
- #pie chart data visualization
- #neon color graph template
- #dual metric comparison slide
- #space theme presentation template
About the Product
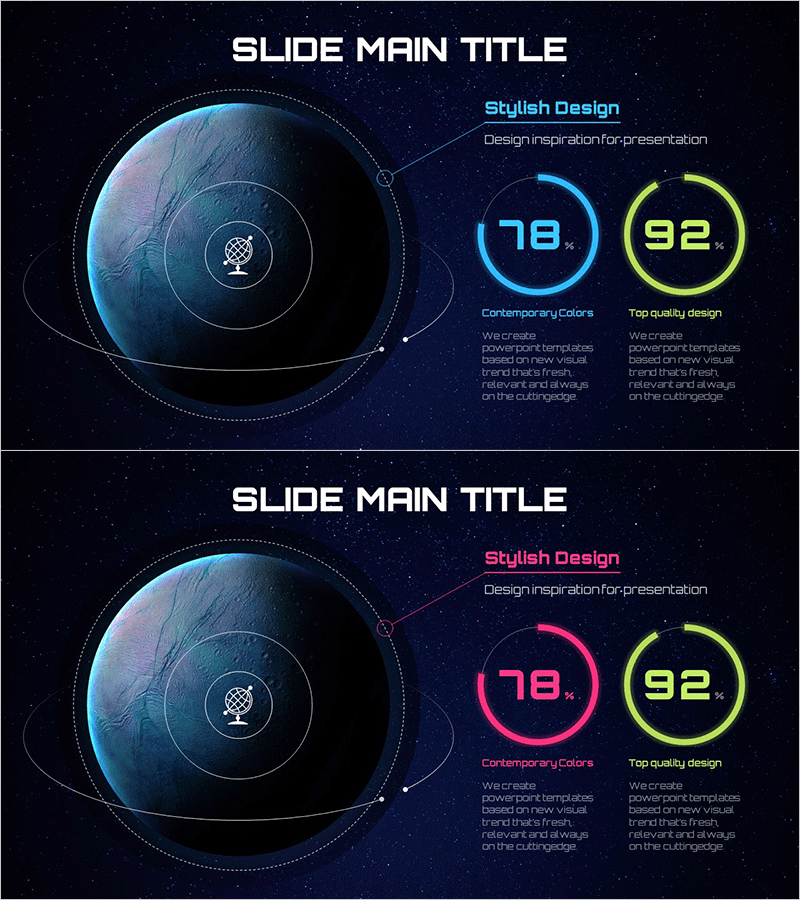
A striking PowerPoint slide featuring two donut-shaped pie charts with neon cyan and lime-green accents on a dark navy starfield background. The design incorporates a central Earth illustration surrounded by concentric orbital lines, creating a space-themed aesthetic. Each donut chart displays percentage values (78% and 92%) to represent comparative data metrics. This 16:9 widescreen template includes two slide layouts with descriptive text areas below each chart, enabling clear information hierarchy. Ideal for technology, aerospace, innovation, and future-focused presentations requiring modern data visualization with high visual impact.
Usage Points
-
Main Usage
Visualize dual metrics, achievement rates, or performance indicators using donut-shaped pie charts. Compare two related KPIs side-by-side or present time-series performance across departments. Neon color accents draw audience attention to critical data points.
-
How to Use
Insert into technology, space, innovation, or future-focused presentations during performance or results sections. Customize percentage values and metric labels in the text areas below each chart. Leverage neon color contrast to emphasize key achievements or targets against the dark background.
-
Recommended For
Technology companies, aerospace firms, energy sector, innovation-focused enterprises presenting to investors. Suitable for tech conferences, quarterly earnings reports, product launch presentations, marketing campaign performance reviews, project progress dashboards, and executive briefings.
-
Slide Structure
Two-slide layout with title area at top, central left Earth illustration with orbital rings, right-aligned dual donut charts (cyan 78%, lime 92%), and descriptive text zones below each chart. 16:9 widescreen format optimized for large-scale presentations and modern display systems.
Related Products
-

Analysis of Work Progress – Utilizing Pie Chart
#Product/Service Introduction #Market and Competitor Analysis #Graph
-

Website Technology Development Status Graph – Market Share and Trends
#Product/Service Introduction #Market and Competitor Analysis #Graph
-

Business Idea Development Status Graph – Ideas and Growth
#Product/Service Introduction #Market and Competitor Analysis #Graph
-

Space Exploration Donut Pie Chart
#Product/Service Introduction #Market and Competitor Analysis #Graph
