Battery Shape Vertical Bar Graph – Market Status Analysis
RJ0700022_15
- Last Update 07/28/2025
- File Size 0.3MB
- # of Slides 2
- File Format PPTX
- Slide Ratio 16:9
- Color
Keywords
- #Content-Based Slides
- #Design-Based Slides
- #Business Introduction
- #Market and Competitor Analysis
- #Graph
- #Other
- #Technological Status
- #Market Analysis
- #Column
- #Column Chart
- #16:9
- #battery chart PowerPoint
- #vertical bar graph slide
- #market analysis presentation
- #business status template
- #data comparison diagram
About the Product
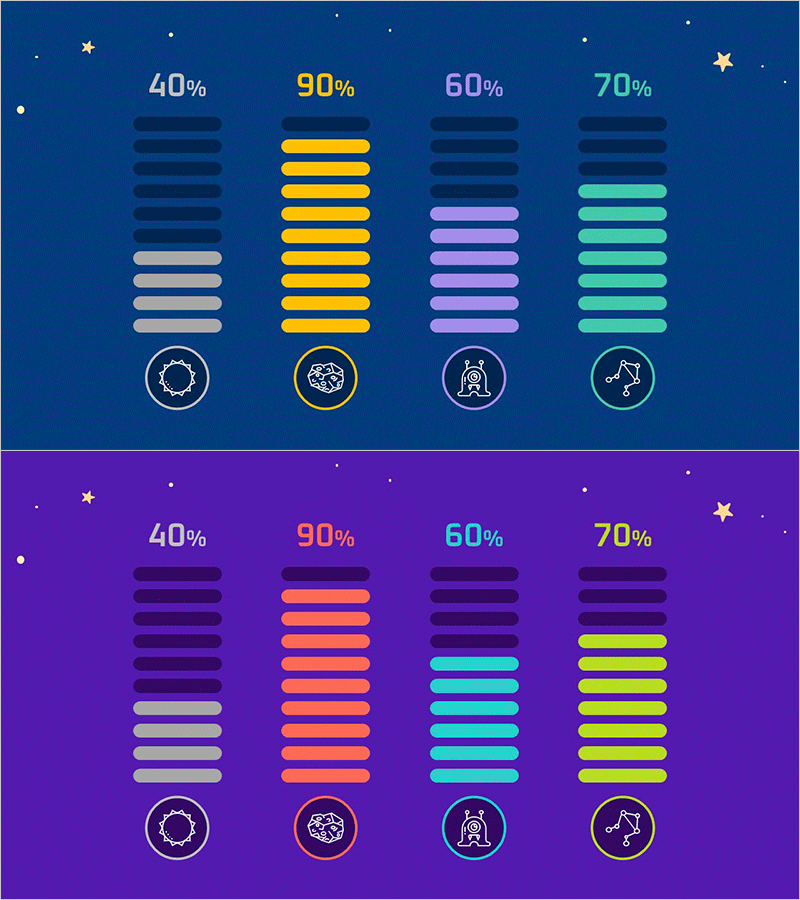
A PowerPoint slide template optimized for market status analysis and business overview presentations using a battery-shaped vertical bar graph design. This slide visualizes numerical data for four items (40%, 90%, 60%, 70%) as battery charge levels, making it ideal for displaying market share, growth rates, competitor comparisons, and business performance metrics. The design features dark blue and purple backgrounds with vibrant colored bars (yellow, pink, lime green) and category icons (gear, globe, bell, chart) beneath each column. The 2-slide set is ready to use immediately for professional presentations.
Usage Points
-
Main Usage
Visualize four data points (market share, growth rate, competitor metrics, business performance) as battery charge levels to enhance clarity and impact in market analysis presentations. The battery metaphor makes numerical comparisons intuitive and memorable for audiences.
-
How to Use
Replace the percentage values and bar lengths with your own data. Customize the icons and colors for each category to match your business context. Choose between dark blue or purple background options to align with your presentation theme and corporate branding.
-
Recommended For
Marketing managers, business development teams, executives preparing quarterly reports, and startup founders presenting investor pitches will find this template effective for market status analysis, competitive positioning, and business performance comparisons.
-
Slide Structure
2-slide template featuring a 4-column battery graph layout. Each slide displays percentage labels at the top (40%, 90%, 60%, 70%), color-coded vertical bars in the center, and category icons (gear, globe, bell, chart) at the bottom to clearly distinguish data categories and enhance visual organization.
Related Products
-

Global Country Analysis Vertical Bar Graph – Market and Competitor Analysis
#Company Introduction #Market and Competitor Analysis #Graph
-

Target Country Analysis Bar Graph – Insights into Global Markets
#Company Introduction #Market and Competitor Analysis #Graph
-

Global Market Analysis Map – Importance of Market Connectivity
#Company Introduction #Market and Competitor Analysis #Graph
-

Vertical Bar PC Mockup Graph – Market and Competitive Analysis
#Market and Competitor Analysis #Graph #Other
