Comparison Graph of Major Shopping Areas – Market Trends Analysis
RJ0400046_12
- Last Update 05/29/2025
- File Size 0.4MB
- # of Slides 2
- File Format PPTX
- Slide Ratio 16:9
- Color
Keywords
- #Content-Based Slides
- #Design-Based Slides
- #Business Introduction
- #Market and Competitor Analysis
- #Graph
- #Other
- #Technological Status
- #Market Analysis
- #Horizontal Bar
- #Horizontal Bar Chart
- #16:9
- #horizontal bar chart PowerPoint
- #market trends analysis slide
- #comparison graph template
- #data visualization PowerPoint
- #how to create bar chart in PowerPoint
About the Product
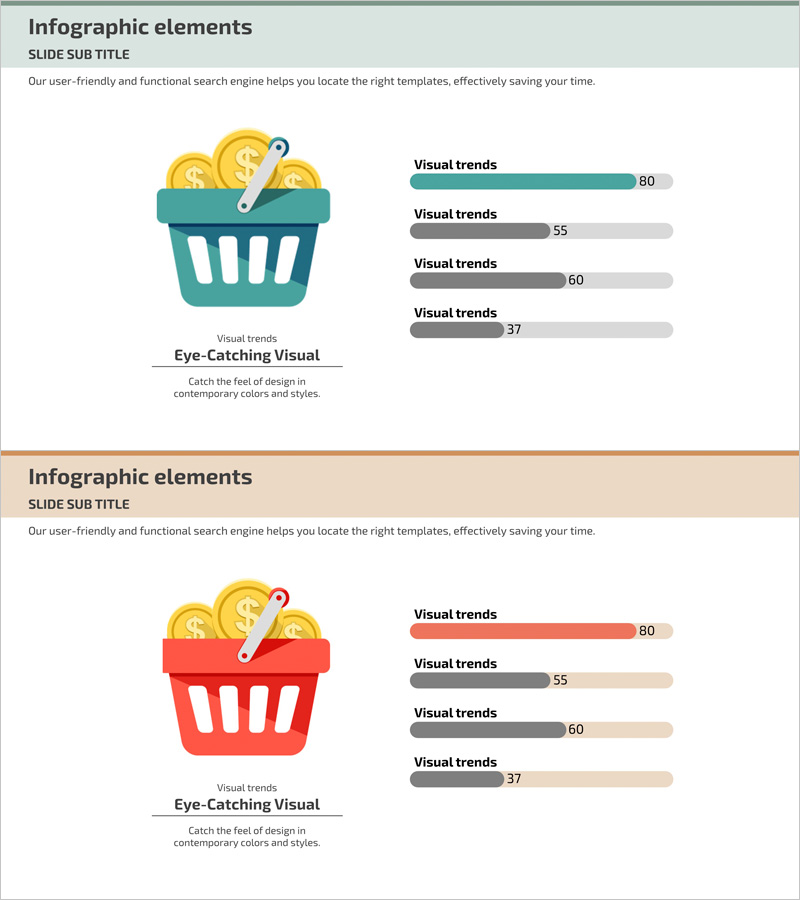
A horizontal bar chart PowerPoint slide for comparing market trends across shopping categories at a glance. This presentation template features teal and gray bar graphs visualizing four data items on a 0–80 scale, with numeric labels displayed beside each bar for precise data communication. The 16:9 widescreen format includes 2 slides ready for immediate use in various presentation scenarios. Colors and values are fully editable, allowing you to adapt this chart design for comparative analysis across multiple industries and business contexts.
Usage Points
-
Main Usage
Visualize and compare multiple data points such as market analysis, sales performance, customer preference surveys, and competitive benchmarking. This bar chart effectively communicates key metrics in executive reports, marketing strategy presentations, and business analysis documents to support data-driven decision-making.
-
How to Use
Double-click the bar lengths and numeric labels to input your actual data values. To adjust colors, select each bar and modify the fill color in the shape formatting options. Item names and legend text are fully editable, enabling you to repurpose this template for various comparative analysis presentations across different industries.
-
Recommended For
Executive and management reports, marketing team market analysis presentations, sales team performance comparisons, consulting firm strategy proposals, financial institution investment analysis documents, and any presentation requiring quantitative data comparison and benchmarking.
-
Slide Structure
Two-slide set featuring the first slide with four teal primary bars and four gray secondary bars for grouped comparison, and the second slide with the same chart structure on a beige background for design flexibility. Numeric labels (0–80 scale) appear beside each bar for accurate data interpretation and professional presentation impact.
Related Products
-

Online Shopping Mall Composition Analysis Graph - Business Analysis and Technical Insights
#Business Introduction #Market and Competitor Analysis #Graph
-

Cell Phone Mockup Bar Graph – Market Analysis and Technology Status
#Business Introduction #Market and Competitor Analysis #Graph
-

Tablet PC Mockup Vertical Bar Graph – Market Analysis and Tech Insights
#Business Introduction #Market and Competitor Analysis #Graph
-

Pencil Bar Chart for Market Analysis – Visual Competitiveness
#Market and Competitor Analysis #Graph #Other
