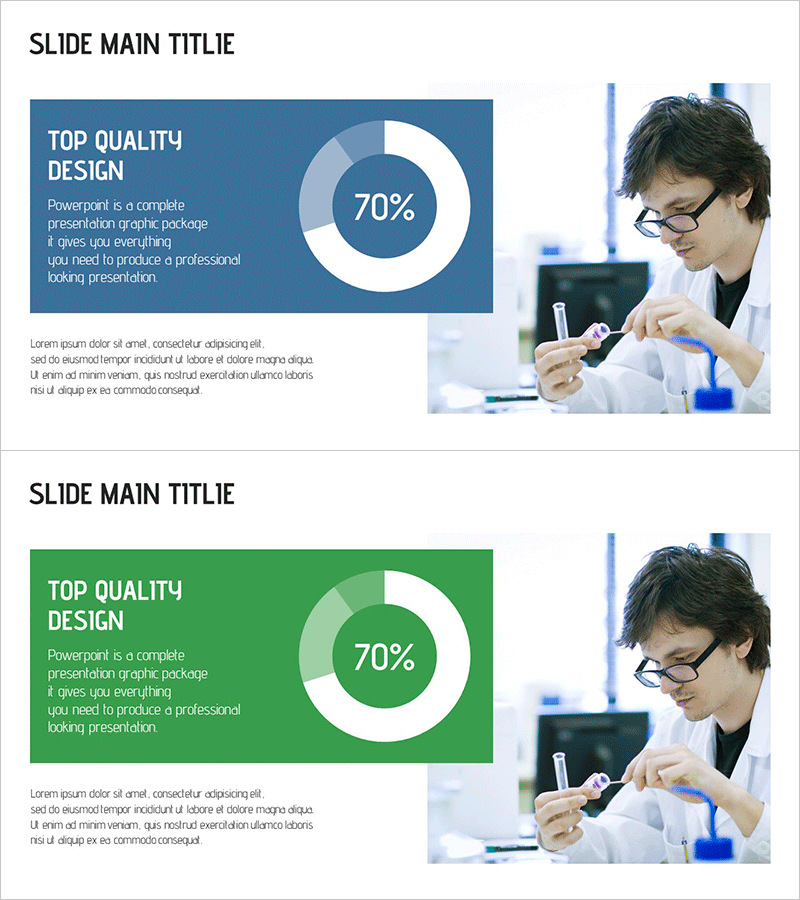
Infographic Slide Visualizing 70% Achievement – Top Quality Design
RJ0700021_7
- Last Update 07/28/2025
- File Size 1MB
- # of Slides 2
- File Format PPTX
- Slide Ratio 16:9
- Color
Keywords
About the Product
A professional donut chart PowerPoint slide set that visualizes 70% achievement rate with dual-color design. The two-slide template features dark blue and light blue tones with balanced text and chart layout, perfect for presenting quantitative performance metrics. Ideal for business reports, project progress updates, and achievement presentations. Formatted in 16:9 widescreen ratio for modern display compatibility and ready for immediate customization.
Usage Points
-
Main Usage
Effectively communicate single-metric data such as achievement rates, project completion percentages, market share, and performance targets using a donut chart format. The centered 70% figure draws immediate attention to your key message.
-
How to Use
Apply to business performance reports, investor pitch decks, marketing plan presentations, quarterly review meetings, and project status updates. Easily edit the percentage value and accompanying text to match your specific data and presentation context.
-
Recommended For
Executive presentations, investor relations, sales team performance reviews, project managers, marketing professionals, and business leaders presenting quantitative results. Suitable for any professional presentation requiring clear numerical achievement visualization.
-
Slide Structure
Two-slide set with consistent layout: dark blue background version and green background version. Each slide contains a title area, descriptive text section on the left, and a prominent donut chart displaying the 70% metric with supporting visual elements.
Related Products
-

Donut Chart of Pharmaceutical Ingredient Composition
#Product/Service Introduction #Technical Approach #Graph
-

Science Experiment Analysis Circle Graph Table Chart – Technological Advancement
#Product/Service Introduction #Technical Approach #Diagram
-

Scientific Experiment Results Analysis Graph – Visualizing Research Outcomes
#Technical Approach #Market and Competitor Analysis #Diagram
-

Donut Chart for Program Plan Progress Visualization
#Business Strategy #Technical Approach #Graph
