Donut Chart for Program Plan Progress Visualization
RJ0900033_7
- Last Update 08/26/2025
- File Size 0.2MB
- # of Slides 2
- File Format PPTX
- Slide Ratio 16:9
- Color
Keywords
- #Content-Based Slides
- #Design-Based Slides
- #Business Strategy
- #Technical Approach
- #Graph
- #Achievements
- #Research and Development
- #Circles
- #Doughnut Chart
- #16:9
- #donut chart PowerPoint
- #pie chart slide template
- #progress visualization PowerPoint
- #program planning slide
- #donut graph template
- #percentage representation slide
About the Product
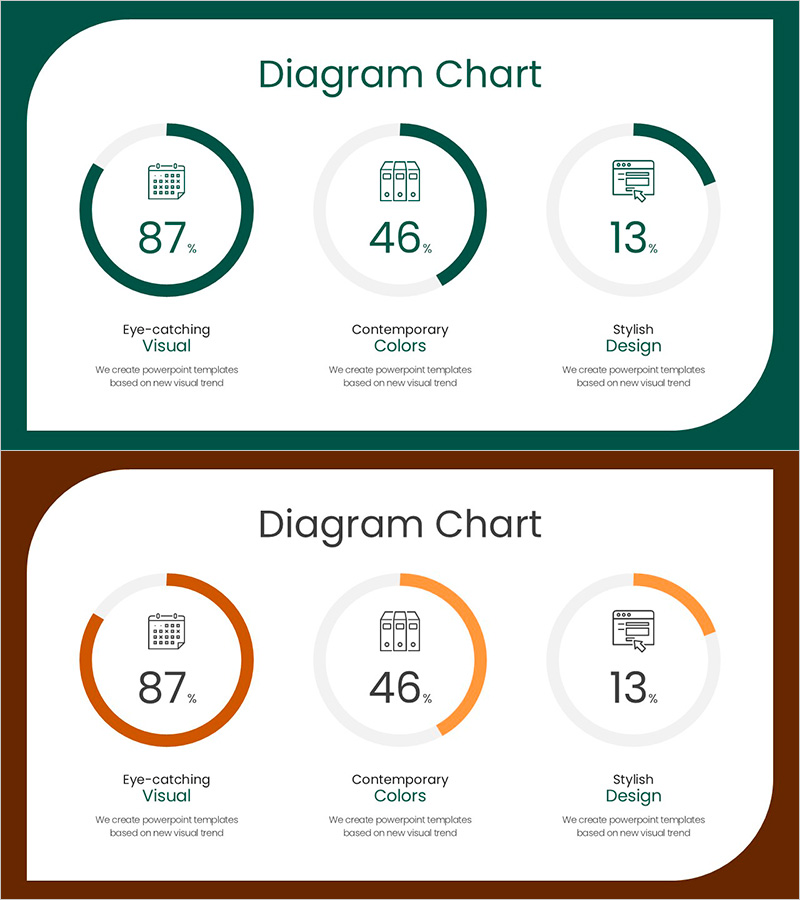
A 3-donut chart slide that visualizes program plan progress with intuitive data representation. Each donut displays independent progress rates (87%, 46%, 13%) with icons and labels for instant category-level comprehension. The design combines dark teal primary charts with light gray secondary elements to establish clear visual hierarchy. Comprising 2 slides optimized for 16:9 widescreen format, this PowerPoint template is fully editable and suitable for expressing project timelines, goal achievement rates, resource utilization, and multi-stage progress tracking across business presentations, quarterly reviews, and stakeholder updates.
Usage Points
-
Main Usage
Designed to display project progress, goal achievement rates, and completion percentages across three parallel categories simultaneously. Each donut chart operates independently, enabling side-by-side comparison of multiple initiatives. Ideal for executive briefings, project reviews, quarterly performance presentations, and stakeholder status updates where concurrent progress tracking is essential.
-
How to Use
Replace the sample percentages (87%, 46%, 13%) with your project data and update the icons and labels to match your categories. The dark teal progress segment and light gray background automatically scale to represent your data ratios—simply input numbers and the visualization is complete. Duplicate charts to accommodate four or more items as needed.
-
Recommended For
Project managers, executives, marketing directors, and operations leaders presenting progress updates. Applicable in business plan strategy sections, quarterly performance reports, investor pitch decks for goal achievement visualization, marketing campaign progress tracking, product development phase completion rates, and resource allocation status across departments.
-
Slide Structure
2-slide set. First slide features dark teal background with 3 donuts arranged horizontally, each displaying centered percentage, icon, and bottom label. Second slide presents identical layout in orange color variant for design flexibility across presentation contexts. Both slides optimized for 16:9 widescreen format, ensuring compatibility with modern presentation environments and professional display standards.
Related Products
-

Cosmetic Ingredient Ratio Chart – Doughnut Slide for Market Analysis
#Business Strategy #Market and Competitor Analysis #Graph
-

Analysis of Climbing Success Rate with Doughnut Chart
#Business Strategy #Market and Competitor Analysis #Graph
-

Donut Chart for Business Strategy Visualization – Performance-Focused Marketing
#Business Introduction #Business Strategy #Marketing Plan and Strategy
-

Construction Facilities Status Donut Chart – Visualizing Business Strategies
#Business Strategy #Market and Competitor Analysis #Graph
