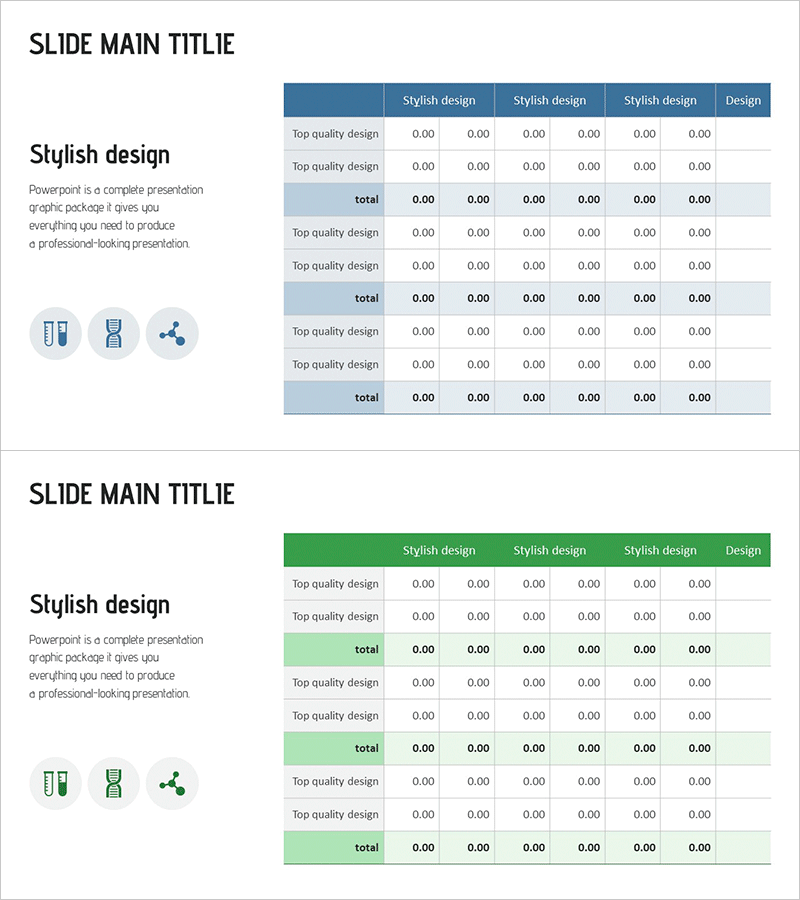
Stylish Design Data Table PowerPoint Slide
RJ0700021_36
- Last Update 07/28/2025
- File Size 1.1MB
- # of Slides 2
- File Format PPTX
- Slide Ratio 16:9
- Color
Keywords
About the Product
A professional PowerPoint slide set designed to organize and compare business data in table format. The slides feature two color schemes—blue and green—with clearly defined header rows and data rows that create visual hierarchy. Provided in 16:9 widescreen format with 2 slides, this template is ready for immediate use in financial reports, performance metrics, market analysis, and comparative presentations. All cells are fully editable, allowing you to input your own data seamlessly. The structured layout ensures your numerical information is presented clearly and professionally to your audience.
Usage Points
-
Main Usage
Used to present numerical data and key metrics in financial reports, market analysis, and performance evaluations. The table format enables quick comparison of multiple items across rows and columns, helping audiences grasp data insights at a glance.
-
How to Use
Open the slide and input your data directly into each cell. Use the blue header for primary categories or metrics and the green header for secondary information. Colors and fonts are fully customizable to match your presentation theme.
-
Recommended For
Finance teams, marketing departments, operations managers, consultants, and data analysts who need to present quantitative information. Ideal for quarterly reports, competitor comparisons, customer satisfaction surveys, and performance dashboards.
-
Slide Structure
2-slide set, each containing 3 independent tables. Each table features a colored header row (blue or green) and alternating data rows (light gray with blue or green accents). Accommodates up to 6-7 columns and 3-4 data rows per table.
Related Products
-

Business Income Statement – Visualizing Financial Performance
#Financial Plans and Performance #Diagram #Income Statement
-

Visualizing Financial Performance with Business Table Chart – Intuitive and Effective
#Financial Plans and Performance #Diagram #Income Statement
-

Key Financial Indicators Table – Effective Data Presentation
#Financial Plans and Performance #Diagram #Income Statement
-

Business Sales and Profit Calculation Table – Essential Slide for Financial Planning
#Financial Plans and Performance #Diagram #Income Statement
