Infographic Slide Visualizing Step-by-Step Process
RJ0700021_32
- Last Update 07/28/2025
- File Size 0.8MB
- # of Slides 2
- File Format PPTX
- Slide Ratio 16:9
- Color
Keywords
- #Content-Based Slides
- #Design-Based Slides
- #Business Vision and Strategy
- #Marketing Plan and Strategy
- #Diagram
- #Business Strategy
- #Marketing Strategy
- #Flow
- #Linear Flow
- #16:9
- #circular process diagram PowerPoint
- #3-step flow chart slide
- #business process visualization PowerPoint
- #how to create process diagram in PowerPoint
- #step-by-step cycle slide template
About the Product
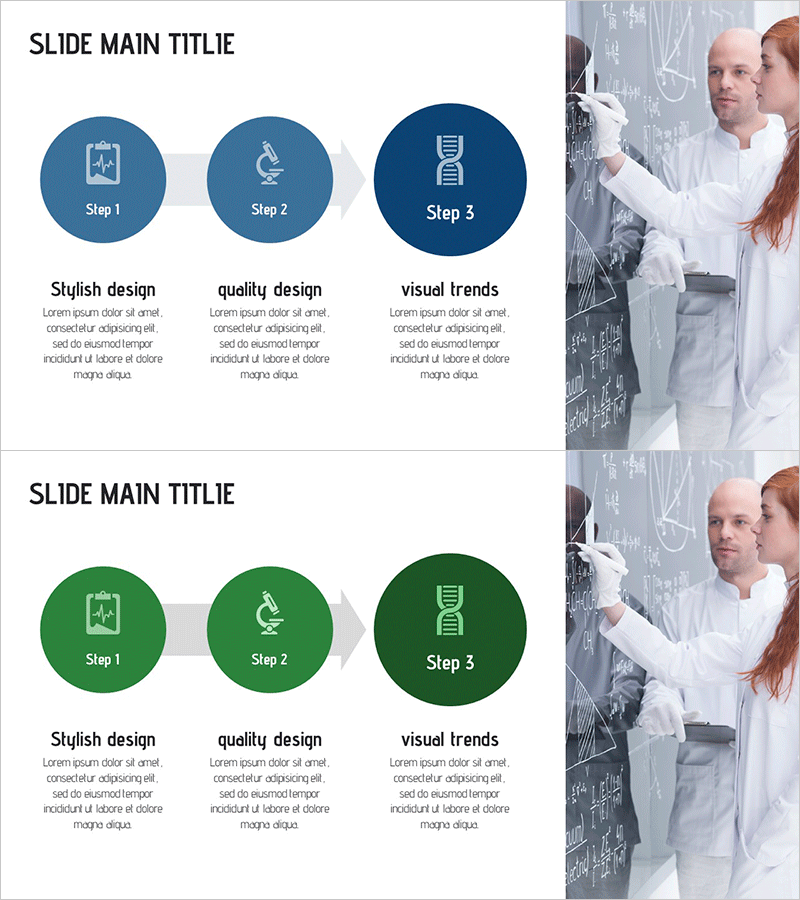
A circular process diagram PowerPoint slide that visualizes three sequential steps using rounded node design. Each step features an icon, title, and descriptive text, making it ideal for illustrating workflow cycles, product development stages, training programs, and business processes. Two color versions—blue and green tones—are included to match your brand identity. The slide is optimized for 16:9 widescreen format in PPTX, with fully editable nodes for customizing step labels, icons, and descriptions.
Usage Points
-
Main Usage
Designed to visualize three-phase cycles such as workflow processes, product development stages, training curricula, marketing campaign phases, and project timelines. The circular layout emphasizes continuity and repetition, helping audiences understand interconnected steps and feedback loops.
-
How to Use
Open the slide and edit the icon, title, and description text in each circular node to match your content. Select the color version (blue or green) that aligns with your brand or presentation theme. Customize node labels, add or remove steps, or adjust arrow directions as needed for your specific use case.
-
Recommended For
Ideal for executives, business strategists, marketing managers, educators, consultants, and project managers presenting business strategies, process improvements, training modules, campaign phases, and operational workflows.
-
Slide Structure
Two-slide set, each featuring three circular nodes (Step 1, Step 2, Step 3) arranged horizontally with connecting arrows showing circular flow. Each node contains an icon area, title field, and descriptive text section. Right side includes a background image (scientists in lab setting) for visual context.
Related Products
-

Step-by-step Business Strategy Diagram – Marketing Plans and Strategies
#Business Vision and Strategy #Marketing Plan and Strategy #Diagram
-

Business Strategy Diagrams & Charts – Example-Centric Market Strategy
#Business Vision and Strategy #Marketing Plan and Strategy #Diagram
-

Sleek Diagrams and Charts – Optimal Design Strategies
#Business Vision and Strategy #Marketing Plan and Strategy #Diagram
-

Corporate Strategy Diagram Leading the Future – Visualizing Business Flow
#Business Vision and Strategy #Marketing Plan and Strategy #Diagram
