Horizontal Bar Chart for Data Visualization – Stylish Presentation
RJ0700021_30
- Last Update 07/28/2025
- File Size 0.7MB
- # of Slides 2
- File Format PPTX
- Slide Ratio 16:9
- Color
Keywords
- #Content-Based Slides
- #Design-Based Slides
- #Technical Approach
- #Market and Competitor Analysis
- #Graph
- #Research and Development
- #Market Analysis
- #Horizontal Bar
- #Grouped Horizontal Bar
- #16:9
- #horizontal bar chart PowerPoint
- #bar graph slide template
- #data visualization presentation
- #comparison chart design
- #numerical data slide
About the Product
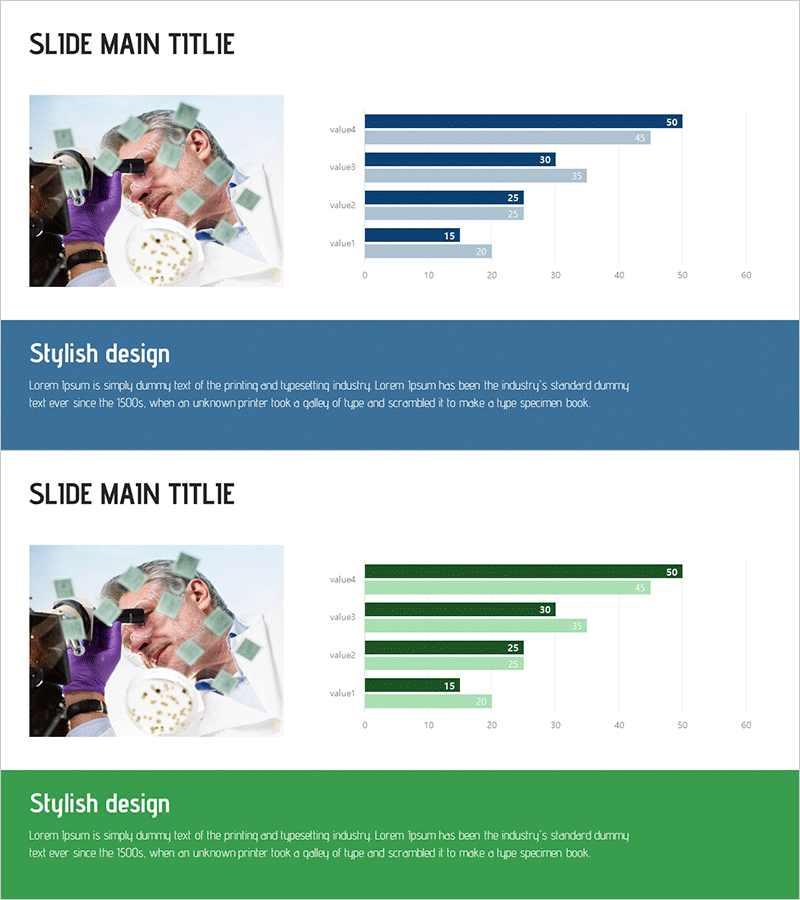
A horizontal bar chart PowerPoint slide optimized for data comparison and ranking visualization. Designed with a two-tone color scheme of dark blue and light blue, it clearly displays numerical values for each item. The 2-slide set provides identical layouts, allowing you to present multiple data sets consistently. In 16:9 widescreen PPTX format, it integrates seamlessly with modern presentation environments. Ready to use immediately for business reports, sales performance analysis, market research presentations, and comparative data visualization.
Usage Points
-
Main Usage
Compares four data points such as sales performance, market share, departmental results, or regional revenue using horizontal bars. The relative size of each item is instantly recognizable, making it highly effective for reports and analytical presentations.
-
How to Use
Edit the bar lengths and numerical labels with your own data. Use dark blue for primary items and light blue for comparative items to create visual emphasis. Duplicate the 2 slides to add multiple data sets.
-
Recommended For
Finance managers, marketing teams, sales directors, and executives presenting quarterly or annual performance reports, competitive analysis, budget allocation status, and comparative metrics.
-
Slide Structure
2-slide set. Each slide features a title area at the top, four item labels (value1–value4) on the left, and horizontal bar charts on the right. Bars are rendered in dark blue (50) and light blue (40–45) tones with numerical labels displayed at the bar ends.
Related Products
-

In-depth Analysis Diagrams & Charts – Insightful Technical Analysis
#Technical Approach #Market and Competitor Analysis #Diagram
-

Blue Orange Bundle Bar Graph - Insights for Market Analysis
#Market and Competitor Analysis #Graph #Competitor Analysis
-

Horizontal Bar Chart for Construction Project Performance Analysis – Stability and Growth
#Market and Competitor Analysis #Diagram #Graph
-

Successful Teamwork Analysis Graph
#Technical Approach #Market and Competitor Analysis #Graph
