Business Radar Chart – Competitor Analysis and Strategy Extraction
RJ0500030_5
- Last Update 06/15/2025
- File Size 0.2MB
- # of Slides 2
- File Format PPTX
- Slide Ratio 16:9
- Color
Keywords
- #Content-Based Slides
- #Design-Based Slides
- #Technical Approach
- #Market and Competitor Analysis
- #Graph
- #Research and Development
- #Market Analysis
- #Other
- #Radar Chart Spider Chart
- #16:9
- #radial radar chart PowerPoint
- #competitor analysis slide template
- #5-axis radar diagram
- #market analysis PowerPoint
- #how to create radar chart in PowerPoint
About the Product
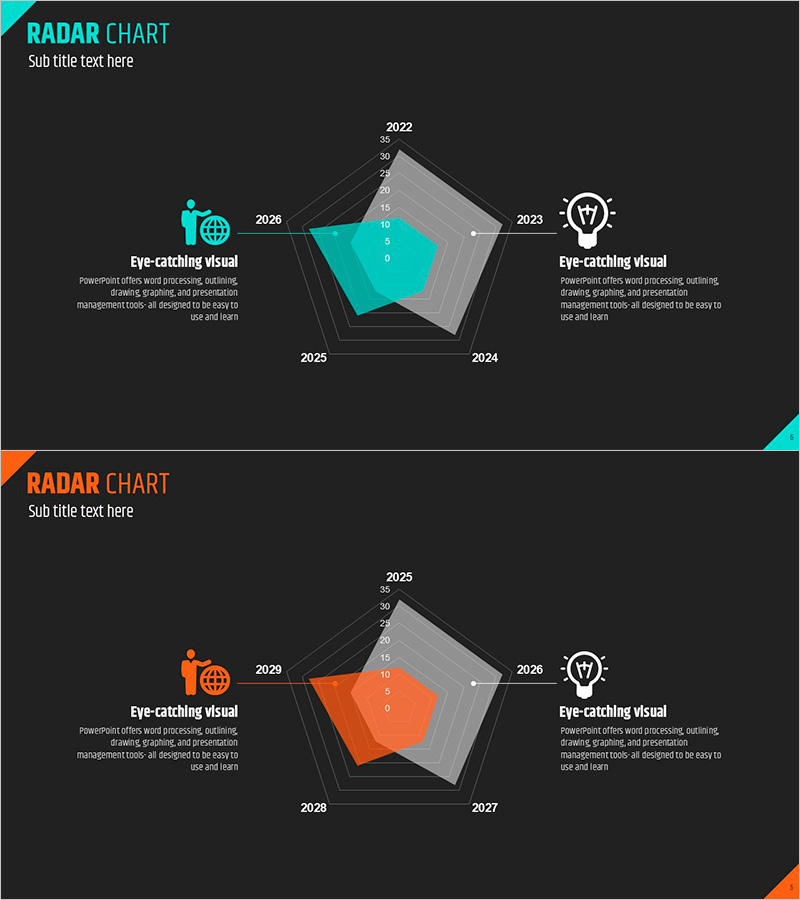
Professional radial radar chart PowerPoint slides designed for business competitive analysis and strategic planning. Two design variations with dark backgrounds and turquoise or orange accent colors provide visual flexibility. Each slide features a 5-axis radar structure (2022–2026 or 2025–2029 timeline) with filled polygon areas for intuitive data comparison. Left and right icon zones with descriptive text enable immediate application to market positioning, competitive benchmarking, capability assessment, and performance evaluation. Fully editable PPTX format in 16:9 widescreen allows customization of axis labels, data values, and color schemes to match corporate branding standards.
Usage Points
-
Main Usage
Visualize multi-dimensional competitive comparisons, market positioning, organizational capability assessments, and performance metrics simultaneously. The radial structure enables stakeholders to instantly identify relative strengths and weaknesses across multiple dimensions in a single view.
-
How to Use
Insert into executive reports, strategy meeting decks, investor presentations, and marketing planning documents where multi-factor comparison is required. Customize axis labels (years, metrics) and data values; colors and fonts adapt to corporate brand guidelines. Both design variants support side-by-side competitive analysis.
-
Recommended For
Executives, strategy teams, marketing professionals, sales leaders, and management consultants requiring data-driven decision-making visuals. Particularly effective for competitive intelligence, market research, performance reviews, and capability diagnostics across industries.
-
Slide Structure
2-slide set. Each slide contains a centered 5-axis filled radar polygon with grid lines, left-side icon + title + descriptive text block, and right-side icon + supplementary information area. Slide 1 features turquoise accent; Slide 2 uses orange accent for visual differentiation during comparative analysis.
Related Products
-

Triangle Pattern Radial Chart – Optimal Data Visualization for Market Analysis
#Market and Competitor Analysis #Marketing Plan and Strategy #Graph
-

Green Yellow Radial Chart
#Market and Competitor Analysis #Graph #Market Analysis
-

Business Direction Radial Chart – Market and Competitive Analysis
#Product/Service Introduction #Market and Competitor Analysis #Graph
-

Goal Setting & Radial Graph – Intuitive Data Visualization
#Business Introduction #Market and Competitor Analysis #Diagram
