Business Customer Analytics Slide – Strategic Insights
RB0100052_4
- Last Update 03/06/2025
- File Size 0.9MB
- # of Slides 2
- File Format PPTX
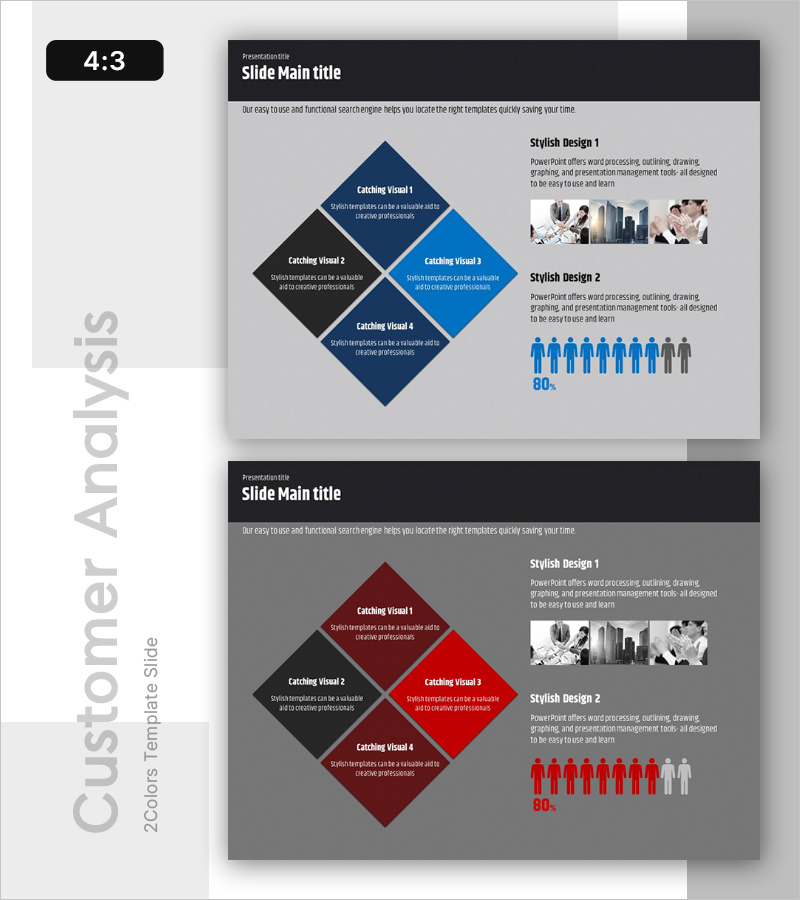
- Slide Ratio 4:3
- Color
Keywords
- #Content-Based Slides
- #Design-Based Slides
- #Business Vision and Strategy
- #Market and Competitor Analysis
- #Diagram
- #Graph
- #Other
- #Business Goals
- #Customer Analysis
- #Cluster
- #Closed Cluster Diagram
- #4:3
- #closed diagram PowerPoint
- #4-node diagram slide
- #cyclical relationship template
- #customer analysis PPT
- #business strategy diagram slide
About the Product
A 4-node closed diagram PowerPoint slide designed to visualize business strategy and customer analysis. The rotated diamond layout features navy, black, and light blue color coding to clearly represent interconnections and cyclical relationships between elements. Each node includes dedicated title and description text areas, enabling effective presentation of business insights, customer segments, and market analysis data. This 2-slide set is ready for immediate use in various presentation scenarios.
Usage Points
-
Main Usage
Illustrate interconnections and cyclical relationships among four key elements in customer analysis, market segmentation, and business strategy development. Position customer segments, market opportunities, competitive factors, and internal capabilities within nodes to support integrated strategic analysis.
-
How to Use
Enter analysis item names in each node's title area and detailed content in the description text field. Use color coding to distinguish item importance or categories, and leverage the rotated layout to emphasize cyclical processes or mutual influence relationships.
-
Recommended For
Executives, marketing professionals, strategic planning teams, and consultants presenting customer analysis results, market entry strategies, and organizational capability assessments. Ideal for business plans, marketing proposals, and strategic reports.
-
Slide Structure
Four nodes arranged in a diamond-shaped closed configuration with color differentiation (navy, black, light blue). Each node contains title and description text input areas. The 2-slide set allows varied color combinations to represent different analysis categories.
Related Products
-

Visualizing User Analysis Data Results with Cluster Diagram Slide
#Market and Competitor Analysis #Diagram #Graph
-

Human Resources Data Analysis - Effective Customer Management Strategies
#Company Introduction #Market and Competitor Analysis #Diagram
-

Key Customer Analysis Data Charts – Assessing Market and Competition
#Company Introduction #Market and Competitor Analysis #Diagram
-

Smart Healthcare Program Overview – Vision and Service Strategy
#Product/Service Introduction #Business Vision and Strategy #Diagram
