Medical Record Chart for Market Analysis – Professional and Modern Design
RJ0700016_25
- Last Update 07/26/2025
- File Size 0.4MB
- # of Slides 2
- File Format PPTX
- Slide Ratio 16:9
- Color
Keywords
About the Product
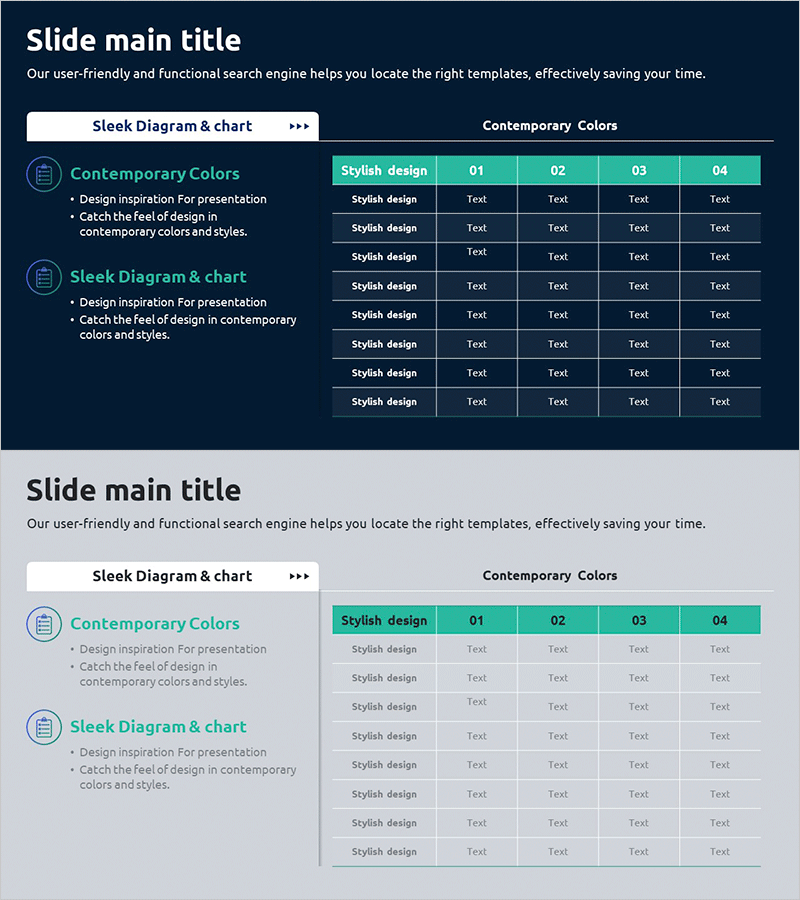
A 2-slide PowerPoint presentation featuring a dark blue background with turquoise header accents and a structured 4-column data table layout. The left section provides space for descriptive text and icons, while the right section displays a multi-row comparison table ideal for market analysis, financial metrics, and statistical data visualization. Each slide accommodates up to 8 rows of data with clear visual hierarchy and category-based information organization. Available in 16:9 PPTX format, fully editable and ready for immediate use in corporate presentations, academic seminars, consulting reports, and business intelligence dashboards.
Usage Points
-
Main Usage
Visualize and compare multi-layered numerical data in a structured format. Designed to present market trends, financial indicators, medical statistics, and competitive analysis with clarity. The distinct separation between explanatory text on the left and tabular data on the right enhances audience comprehension and decision-making.
-
How to Use
Enter analysis topics and key insights in the left text box, then populate the right table with specific metrics and values. Customize header categories and data rows to fit various comparison scenarios. Adjust colors to align with your brand identity while maintaining the professional layout structure.
-
Recommended For
Ideal for financial analysis, market research, medical statistics, management reports, consulting proposals, and academic presentations. Suited for CFOs, data analysts, researchers, consultants, and marketing professionals who need to communicate complex information clearly and persuasively.
-
Slide Structure
2-slide deck with each slide divided into left section (approximately 30%) containing icon and text area, and right section (approximately 70%) with a 4-column data table. Table includes 1 header row and up to 8 data rows, with flexible cell content for text, numbers, and percentages.
Related Products
-

Modern Blue Pie Chart Template – Market Share Analysis
#Market and Competitor Analysis #Diagram #Graph
-

Emergency Patient Record Sheet – Effective Diagram for Market Analysis
#Market and Competitor Analysis #Diagram #Market Analysis
-

Paper Clip Theme Table – Market Analysis Use
#Market and Competitor Analysis #Diagram #Market Analysis
-

Touch Wide Slide Template – Column Chart & Table
#Market and Competitor Analysis #Diagram #Graph
