Market and Competitor Analysis Graph – A New Way to Visualize Data
RJ0700016_23
- Last Update 07/26/2025
- File Size 0.4MB
- # of Slides 2
- File Format PPTX
- Slide Ratio 16:9
- Color
Keywords
About the Product
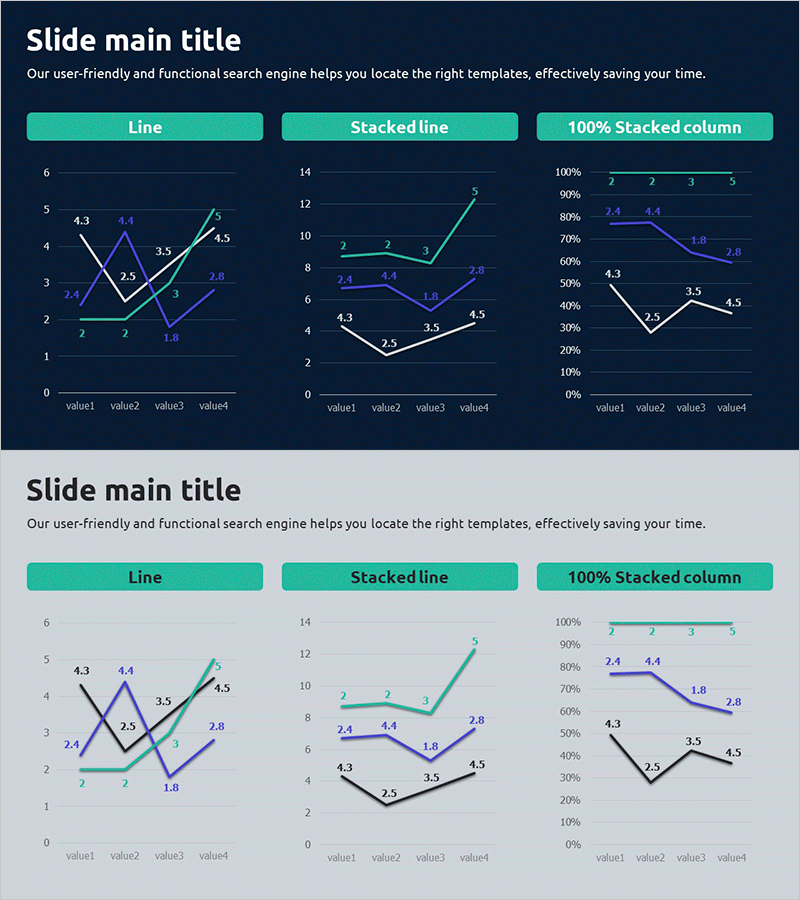
This slide utilizes line and stacked graphs for market and competitor analysis, intuitively visualizing data. The clean combination of navy and gray colors offers stability and reliability during presentations. It serves as a useful resource for creating reports, market analyses, and investment proposals. It is particularly suitable for comparing the performance of the market and competitors over specific quarters or years. Text and graph replacements are easy, with an editing difficulty rated as 'easy', making it convenient for various presentations.
Usage Points
-
Main Usage
- This template is ideal for showcasing market trends and competitor comparisons during business meetings, allowing stakeholders to make informed decisions based on visual data representations.
-
How to Use
- Professionals can utilize this template in quarterly reviews or investment proposal meetings, where clear graphical representations enhance understanding and facilitate discussions among team members and executives.
-
Recommended For
- This resource is particularly beneficial for analysts, marketing managers, and business development teams who need to present data-driven insights to clients or upper management.
-
Slide Structure
- The set consists of multiple slides that guide the audience through a logical flow, beginning with an overview of market conditions, followed by detailed comparisons, and concluding with actionable insights for strategic planning.
Related Products
-

Market Analysis 3D Graph – Visualizing Competitive Market Research
#Market and Competitor Analysis #Graph #Competitor Analysis
-

Fintech Market Analysis Bar Graph – Clear Data Visualization
#Market and Competitor Analysis #Diagram #Graph
-

Monthly Analysis Bar Graph Chart – Ideal for Market and Competitor Analysis
#Market and Competitor Analysis #Graph #Competitor Analysis
-

Data Analysis Bar Graph – Essential for Market and Competitor Analysis
#Market and Competitor Analysis #Graph #Competitor Analysis
