SEO System Analysis Graph – Understanding Market and Competitors
RJ0400051_15
- Last Update 05/31/2025
- File Size 5.3MB
- # of Slides 2
- File Format PPTX
- Slide Ratio 16:9
- Color
Keywords
- #Content-Based Slides
- #Design-Based Slides
- #Market and Competitor Analysis
- #Graph
- #Competitor Analysis
- #Market Analysis
- #Column
- #Segmented Column
- #16:9
- #stacked bar chart PowerPoint
- #bar graph presentation slide
- #data visualization template
- #market analysis chart
- #competitive comparison graph
- #PowerPoint slide design
About the Product
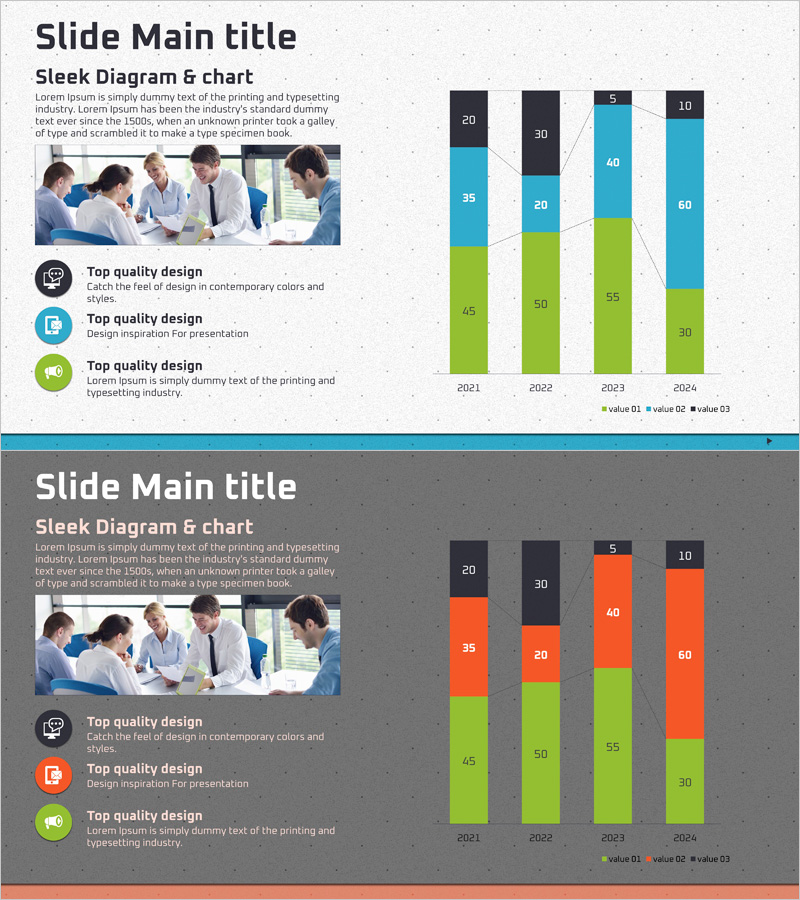
A stacked bar chart PowerPoint slide designed for market analysis and competitive comparison. The chart uses three data series (lime, sky blue, and black) to display year-over-year changes from 2021 to 2024. Each bar is divided into three segments representing value 01, 02, and 03, enabling simultaneous visualization of overall trends and individual item comparisons. This presentation template is ready to use in business reports, marketing plans, and strategy presentations for displaying market size, sales performance, customer satisfaction, and other key metrics.
Usage Points
-
Main Usage
Visualizes annual or quarterly data trends using stacked bars to simultaneously show change over time and each item's contribution. Highly effective for comparative analysis of complex metrics such as market size, revenue, and customer count.
-
How to Use
Replace the displayed numbers with your own data for immediate use. The lime, sky blue, and black color scheme can be customized to match your corporate brand colors. Years and item labels are fully editable.
-
Recommended For
Marketing managers, planners, analysts, and executives use this template when presenting market conditions, competitor analysis, sales results, and customer satisfaction metrics. Ideal for business plans, quarterly reports, strategy presentations, and investor briefings to enhance data credibility.
-
Slide Structure
Two-slide set. First slide features a light background with four stacked bar charts (2021–2024) in lime, sky blue, and black. Second slide displays the same chart structure on a dark background. Each bar is divided into three segments with numerical labels clearly displayed.
Related Products
-

Monthly Analysis Graph of Banking Services Sector – Market and Competitor Analysis
#Market and Competitor Analysis #Financial Plans and Performance #Graph
-

Business Goal Setting & Analysis Graph – For Competitive Analysis
#Market and Competitor Analysis #Marketing Plan and Strategy #Graph
-

Fintech Market Analysis Bar Graph – Clear Data Visualization
#Market and Competitor Analysis #Diagram #Graph
-

Business Analysis Segmented Vertical Bar Graph – Optimized for Market and Competitor Analysis
#Market and Competitor Analysis #Graph #Competitor Analysis
