Paper Clip Theme Table – Market Analysis Use
RJ0700014_28
- Last Update 07/25/2025
- File Size 2.5MB
- # of Slides 2
- File Format PPTX
- Slide Ratio 16:9
- Color
Keywords
About the Product
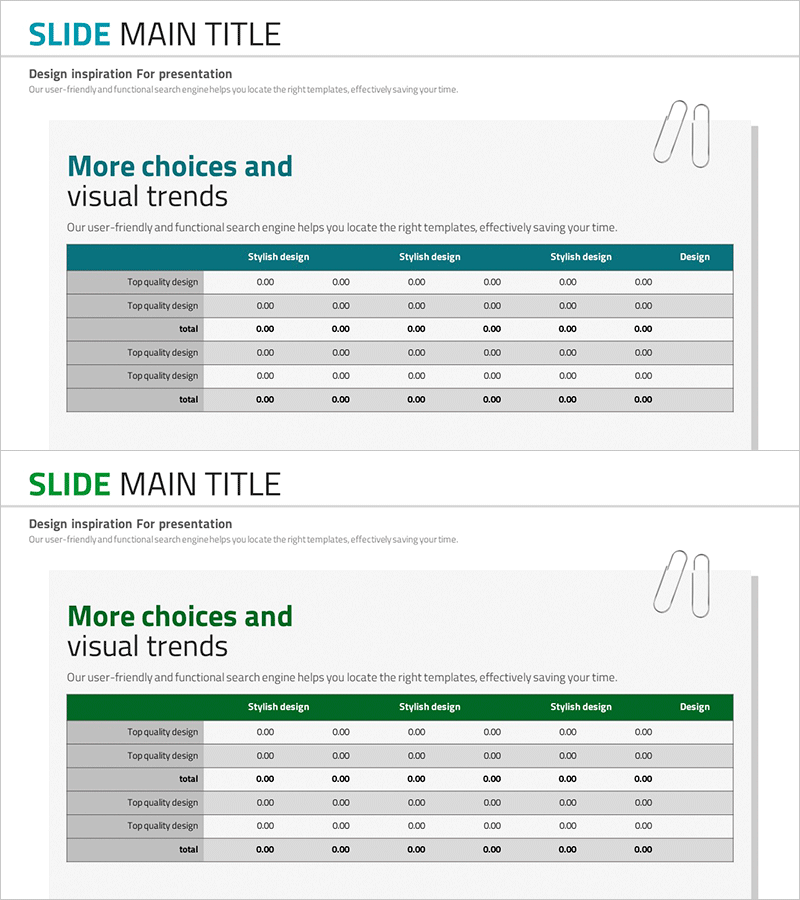
A multi-row table PowerPoint slide optimized for market analysis and competitive comparison. Features a teal header row and gray data rows that create a clear visual hierarchy for presenting up to 6 comparison items and 5+ rows of data. Paper clip icon accents add visual interest to your presentation, while the 16:9 widescreen format provides ample space for data entry. The 2-slide set allows flexible arrangement of various analytical datasets, and all content is fully editable in PPTX format for immediate use.
Usage Points
-
Main Usage
Systematically compare and analyze quantitative data across multiple dimensions. Ideal for presenting market conditions, competitive benchmarking, product specifications, financial metrics, and other multi-factor comparisons while maintaining clarity and visual impact.
-
How to Use
Enter comparison item names in the header row, then populate data rows with category-specific figures. Use color differentiation to separate sections or highlight key metrics. During presentations, use a pointer to reference specific cells while explaining data insights and drawing conclusions.
-
Recommended For
Marketing managers, strategy planners, financial analysts, and executives presenting data-driven insights to leadership, investors, and partners. Suitable for business plans, market analysis reports, competitive intelligence documents, and financial presentations.
-
Slide Structure
2-slide set with 6-column × 5+ row input areas per slide. Teal header row clearly distinguishes column categories, while gray row backgrounds visually separate data groups. Paper clip icon positioned in upper right corner serves as a design accent element.
Related Products
-

Market Analysis Report Visualized with Pie Chart
#Market and Competitor Analysis #Diagram #Graph
-

Space Themed Table – Suitable for Data Visualization Slides
#Market and Competitor Analysis #Diagram #Market Analysis
-

Business Plan Presentation Template - Asia Map
#Market and Competitor Analysis #Diagram #Other
-

Business Forest Wide Template Europe Map – A New Horizon for Market Analysis
#Market and Competitor Analysis #Financial Plans and Performance #Diagram
