Thermometer Analysis Bar Graph – Visualizing Market Competitiveness
RJ0700014_27
- Last Update 07/25/2025
- File Size 0.4MB
- # of Slides 2
- File Format PPTX
- Slide Ratio 16:9
- Color
Keywords
About the Product
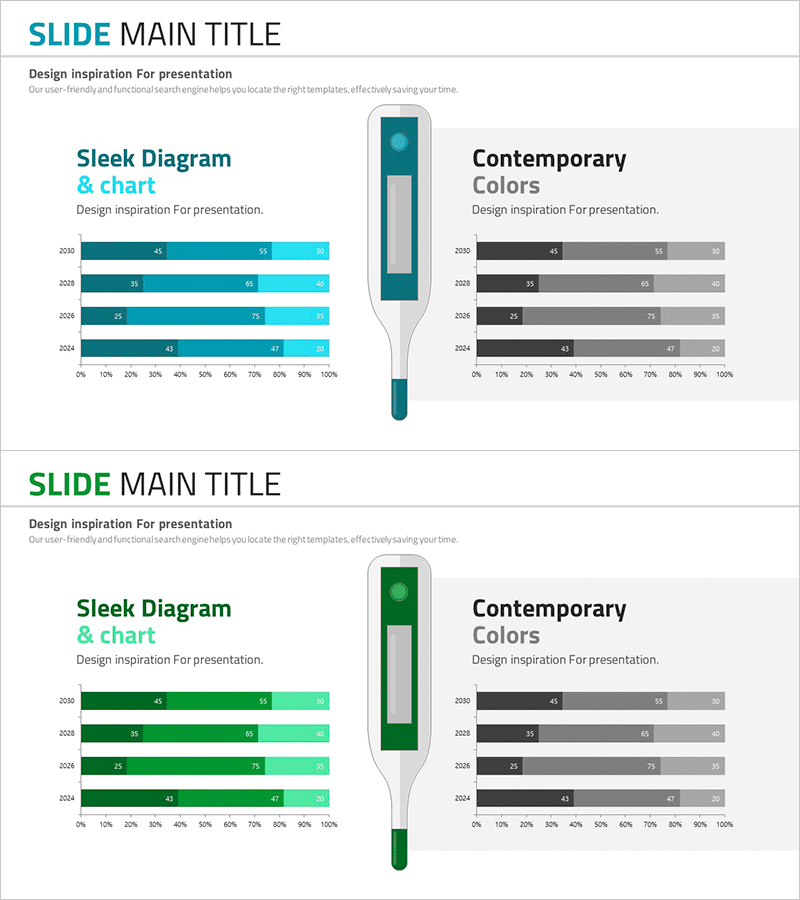
A horizontal bar chart PowerPoint slide in thermometer design that visualizes market competitiveness intuitively. It displays competitor performance across four years (2022–2025) using teal and gray color schemes, enabling clear numerical comparison for each item. The 100% stacked bar format effectively represents market share, customer satisfaction, product competitiveness, and other metrics at a glance. This design is highly effective for communicating competitive positioning in presentations, business reports, and marketing strategy documents.
Usage Points
-
Main Usage
Compares competitor performance across years and items, clearly visualizing your company's market position. The thermometer design expresses competitive intensity as temperature perception, enhancing audience comprehension.
-
How to Use
Apply to competitive analysis sections in business reports, market situation analysis in marketing strategy documents, and competitive advantage comparison slides in investor pitch decks. Replace bar values with your own data for immediate presentation use.
-
Recommended For
Recommended for marketing team market analysis presentations, executive business performance reports, sales team competitive situation briefings, and consultant strategy proposal materials. Particularly valuable in highly competitive industries such as finance, IT, manufacturing, and retail.
-
Slide Structure
Two-slide set featuring teal thermometer bar chart (4 years × 3–4 stacked items) on the first slide and gray-scheme identical structure on the second. Each slide includes title, legend, 0–100% horizontal axis, and year-by-year rows.
Related Products
-

Global Network Analysis Graph – Ideal for Market and Competitor Analysis
#Market and Competitor Analysis #Graph #Competitor Analysis
-

Detailed Bar Analysis Graph – Market and Competitor Insights
#Market and Competitor Analysis #Graph #Competitor Analysis
-

Global Business Analysis Graph – Market and Competitor Analysis
#Market and Competitor Analysis #Graph #Competitor Analysis
-

Detailed Emphasis Bar Graph for Market and Competitor Analysis
#Market and Competitor Analysis #Graph #Competitor Analysis
