Emergency Patient Record Sheet – Effective Diagram for Market Analysis
RJ0700014_26
- Last Update 07/25/2025
- File Size 0.3MB
- # of Slides 2
- File Format PPTX
- Slide Ratio 16:9
- Color
Keywords
About the Product
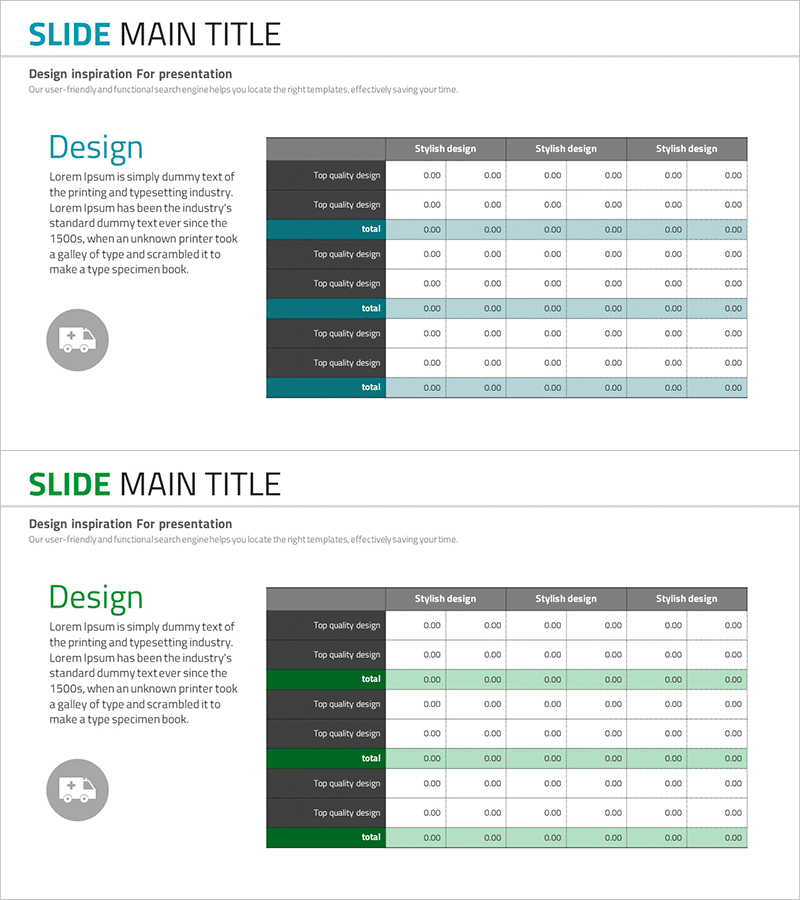
A professional PowerPoint slide designed to visualize complex financial data such as return on investment, income statements, and financial metrics. The layout features a left-side text area paired with a right-side multi-column table structure, enabling simultaneous presentation of explanations and data. Dark gray header rows and turquoise accent rows highlight key figures, while the table accommodates 6+ columns and 8+ rows for large datasets. Ideal for immediate use in investor relations materials, financial reports, and executive presentations.
Usage Points
-
Main Usage
Transforms complex financial metrics—ROI, income statements, budget forecasts, and performance indicators—into structured table format for clear data-driven decision-making. The two-column layout (left explanation + right data table) maximizes information delivery efficiency and audience comprehension.
-
How to Use
Deploy in investor relations decks, quarterly earnings presentations, financial reports, and executive briefings to communicate financial performance through data. Input category names in dark gray header rows, totals in turquoise accent rows, and monthly/quarterly/annual figures in remaining rows for seamless data entry.
-
Recommended For
Ideal for CFOs, finance teams, investor relations professionals, executives, and investment pitch presentations. Particularly effective for public company earnings announcements, venture funding pitches, bank loan reviews, and consulting reports requiring financial credibility backed by numerical evidence.
-
Slide Structure
Two-slide set with first slide featuring turquoise accent row and second slide with green accent row for section differentiation. Each slide provides 6+ columns × 8+ rows of data input capacity, with balanced left-side icon and text area (approximately 200 characters) and right-side table section.
Related Products
-

Market Analysis Table Chart – Practical Data Visualization
#Market and Competitor Analysis #Diagram #Market Analysis
-

European Target Market Analysis Table
#Market and Competitor Analysis #Diagram #Other
-

Business Plan Presentation Template - Asia Map
#Market and Competitor Analysis #Diagram #Other
-

Market Analysis Report Visualized with Pie Chart
#Market and Competitor Analysis #Diagram #Graph
