World Map Data Slide | Regional Statistics Visualization PPT
RJ0600098_19
- Last Update 07/17/2025
- File Size 1MB
- # of Slides 2
- File Format PPTX
- Slide Ratio 16:9
- Color
Keywords
- #Design-Based Slides
- #Market and Competitor Analysis
- #Marketing Plan and Strategy
- #Other
- #Market Analysis
- #Target Market
- #Distribution Strategy
- #Table
- #Horizontal Table
- #Map
- #16:9
- #world map PowerPoint slide
- #regional data visualization
- #location pin diagram
- #global map presentation
- #branch office distribution slide
- #sales distribution map
About the Product
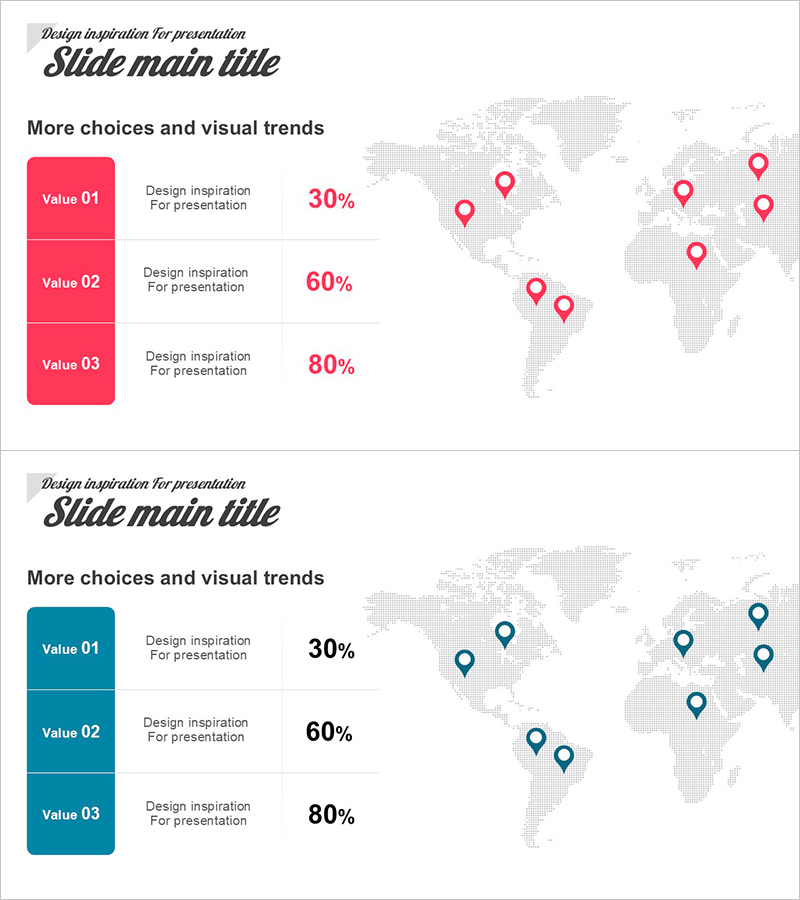
A 2-slide PowerPoint set visualizing regional statistics with location pin markers on a world map. Features a light gray world map background with pink and teal location pin icons positioned across continents, ideal for showcasing global market distribution, branch office locations, and regional sales analysis. Available in 16:9 widescreen PPTX format with fully editable elements. Perfect for international business presentations, regional performance reports, and global network overviews.
Usage Points
-
Main Usage
Visualize geographic data distribution and global network presence using location pin markers on a world map. Transform complex regional information into an intuitive map-based format that helps audiences quickly grasp international business scope and regional performance metrics.
-
How to Use
Use in international business presentations to display global branch distribution, overseas market expansion status, and regional revenue contribution. Ideal for investor presentations emphasizing global network scale, regional performance reports showing area-specific metrics, and strategic planning discussions involving geographic expansion.
-
Recommended For
International sales and marketing professionals, global business strategy teams, overseas branch management departments, investor relations specialists, and regional performance analysts. Suitable for multinational corporation executive briefings and international conference presentations.
-
Slide Structure
Slide 1: Light gray world map with 6-8 pink location pin markers distributed across regions / Slide 2: Light gray world map with 6-8 teal location pin markers positioned on continents. Each slide combines map background, location pin icons, and percentage values to clearly communicate regional distribution and contribution metrics.
Related Products
-

Global Target Market Analysis Graph
#Market and Competitor Analysis #Diagram #Graph
-

Target Country Year-by-Year Analysis Chart – Data Visualization for Market Analysis
#Market and Competitor Analysis #Graph #Other
-

Science and Technology Observation Target Market – Market Analysis Slide
#Market and Competitor Analysis #Other #Market Analysis
-

Target Market Year-to-Year Comparison Analysis – Visualizing Market Trends
#Market and Competitor Analysis #Graph #Other
