Space Industry Analysis Bar Graph – Market and Competitive Analysis
RJ0700013_19
- Last Update 07/25/2025
- File Size 1.2MB
- # of Slides 2
- File Format PPTX
- Slide Ratio 16:9
- Color
Keywords
- #Content-Based Slides
- #Design-Based Slides
- #Market and Competitor Analysis
- #Marketing Plan and Strategy
- #Graph
- #Competitor Analysis
- #Marketing Strategy
- #Column
- #Segmented Column
- #16:9
- #stacked bar chart PowerPoint
- #time series data visualization slides
- #market analysis graph template
- #competitive analysis chart
- #4-year comparison graph
- #space industry analysis PPT
- #data visualization slide template
About the Product
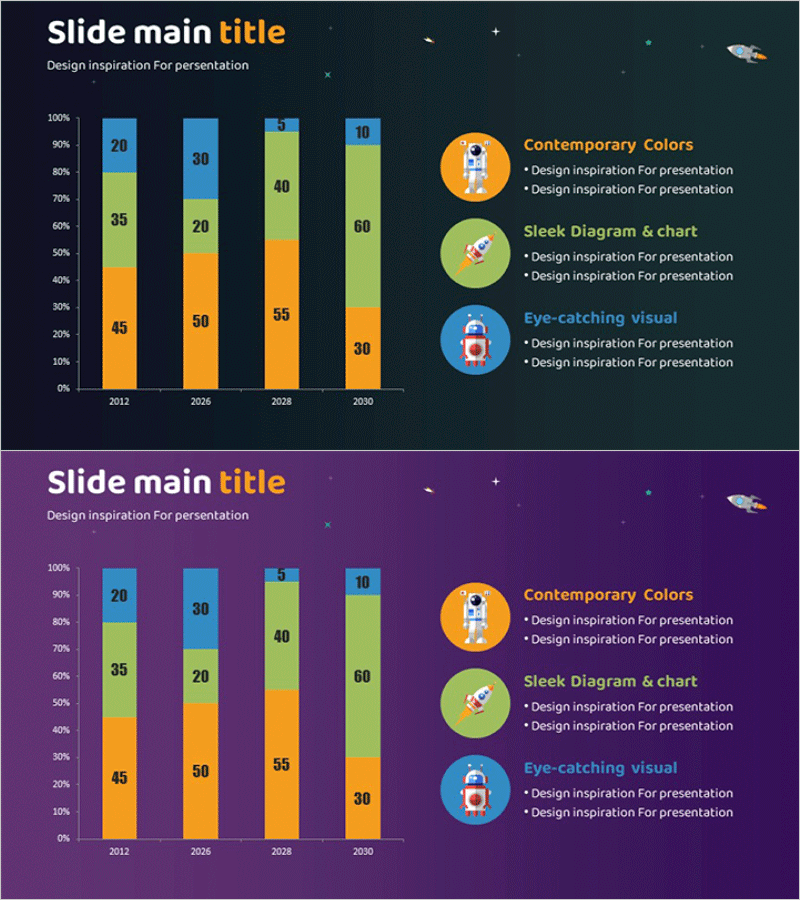
A stacked bar chart PowerPoint slide set designed for space industry market analysis and competitive landscape assessment. This 2-slide presentation template features a dark navy background with three-color series (orange, lime, sky blue) visualizing data across four years from 2012 to 2030. Each bar is segmented into three categories to simultaneously display composition ratios and absolute values, with clear data labels on every segment. Ideal for aerospace, space technology, and emerging industry market reports, competitive analysis presentations, and strategic planning decks that require time-series data visualization.
Usage Points
-
Main Usage
Effectively tracks composition ratio changes across time periods and compares year-over-year growth trends. The stacked bar format simultaneously displays total scale and individual series contribution, enabling intuitive interpretation of complex multi-dimensional data.
-
How to Use
Use in market overview reports, competitive landscape presentations, and strategic planning meetings for aerospace, space technology, and emerging industries. The two identical-structure slides allow parallel comparison of multiple metrics such as market size, market share, and growth rates across different business segments.
-
Recommended For
Suitable for presentations to executives, marketing teams, strategic planning departments, sales teams, and investors. Particularly effective when evaluating new market entry opportunities, analyzing market potential, and supporting data-driven decision-making in competitive strategy development.
-
Slide Structure
2-slide set. Each slide contains one stacked bar chart covering four years (2012, 2026, 2028, 2030). Bars are segmented into three series (orange, lime, sky blue) with numerical labels on each segment. Right side includes three circular icon legends (Contemporary Colors, Sleek Diagram & chart, Eye-catching visual). 16:9 widescreen format, PPTX file type.
Related Products
-

Analysis of Annual Health Checkup Data – Market and Marketing Strategies
#Market and Competitor Analysis #Marketing Plan and Strategy #Graph
-

Analysis Vertical Bar Graph – Market Competitiveness Visualization
#Market and Competitor Analysis #Graph #Competitor Analysis
-

Market Trends Analysis Chart – Effective for Market and Marketing Strategy
#Market and Competitor Analysis #Marketing Plan and Strategy #Diagram
-

Subdivided Bar Graph for Visual Market Analysis – Presenting Competitive Data Effectively
#Market and Competitor Analysis #Diagram #Graph
