Medical Donut Circle Graph – Effective Market Analysis
RJ0700012_21
- Last Update 07/25/2025
- File Size 0.3MB
- # of Slides 2
- File Format PPTX
- Slide Ratio 16:9
- Color
Keywords
About the Product
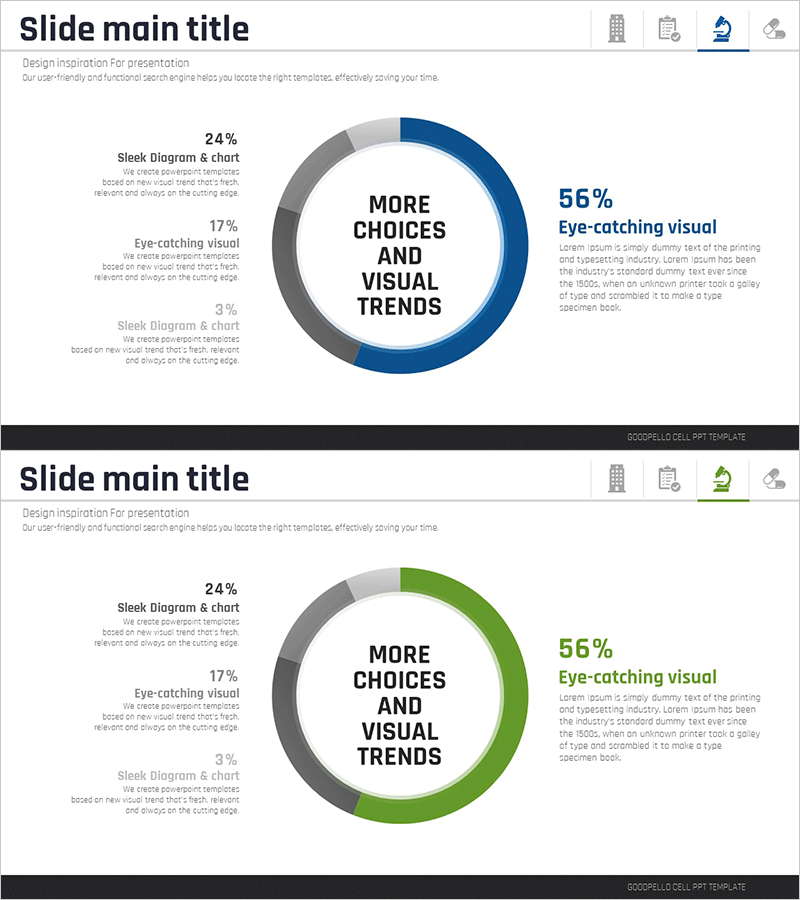
A donut chart PowerPoint slide that visually represents the ratio of three items using navy, gray, and green colors. The center area is designed for placing key messages or titles, creating an effective emphasis effect. Each segment displays percentage values and descriptive text, making it ideal for market analysis, data comparison, and ratio explanation in presentations. The template consists of 2 slides optimized for 16:9 widescreen format. All elements including percentages, labels, and colors are fully editable for immediate use in your presentation.
Usage Points
-
Main Usage
Designed to compare and explain the ratio, composition, and market share of three items at a glance. Effectively visualizes market analysis, customer demographics, product category revenue distribution, organizational structure, budget allocation, and similar ratio-based data. The center area emphasizes key messages or presentation titles.
-
How to Use
Replace percentage values with your actual data and update legend text with corresponding item names. Adjust colors to match your corporate brand or presentation theme. Use both slides to compare different data sets, selecting them strategically based on your presentation flow. All text and numerical values are easily customizable.
-
Recommended For
Marketing professionals, financial analysts, business executives, consultants, educators, and data-driven presenters. Ideal for market overview presentations, business performance reports, customer analysis, organizational structure explanations, and any presentation requiring ratio-based data visualization.
-
Slide Structure
2-slide template. Each slide features a center donut chart (3 segments) with a legend area on the left. The donut segments display navy (56%), gray (24%), and green (20%) proportions with percentage labels and descriptive text beside each section. Optimized for 16:9 widescreen display format.
Related Products
-

Shareholder Status Analysis Slide – Data-Driven Market Insights
#Company Introduction #Market and Competitor Analysis #Diagram
-

Status Analysis Donut Chart – Shareholder Status Analysis
#Company Introduction #Market and Competitor Analysis #Diagram
-

Donut Chart Visualizing Merchandise Sales Proportion
#Market and Competitor Analysis #Graph #Market Share
-

Regional Demand Survey Graph – Key to Market Analysis
#Market and Competitor Analysis #Financial Plans and Performance #Graph
