Income Statement Table Chart – Financial Performance Analysis
RJ0700012_16
- Last Update 07/25/2025
- File Size 0.3MB
- # of Slides 2
- File Format PPTX
- Slide Ratio 16:9
- Color
Keywords
- #Content-Based Slides
- #Design-Based Slides
- #Financial Plans and Performance
- #Diagram
- #Income Statement
- #Table
- #Standard Table
- #16:9
- #income statement table
- #financial table PowerPoint
- #income statement slide template
- #financial data comparison chart
- #table slide design
- #financial performance analysis template
About the Product
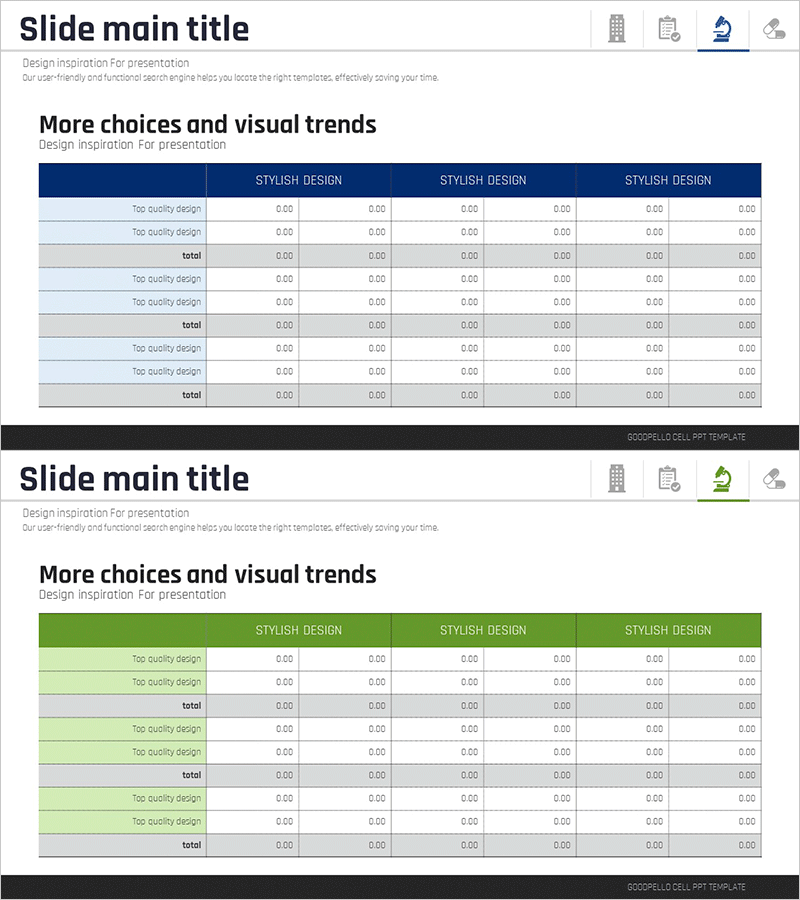
A professional income statement table PowerPoint slide designed to clearly present financial performance analysis. This 2-slide template features a dark blue header row and light blue alternating row backgrounds, organizing revenue, expenses, and profit items across 6 columns for easy quarter-by-quarter or year-over-year financial comparison. Each data row includes labeled categories and numeric input fields (0.00 format) for immediate data entry and editing, with a total row emphasizing cumulative results. The structured table layout makes it ideal for investor reports, executive briefings, financial analysis presentations, and quarterly earnings reviews.
Usage Points
-
Main Usage
Present financial performance and income statement data in a structured table format to executives, investors, and stakeholders. Optimized for comparing quarterly, annual, or departmental profit and loss figures with clear visual hierarchy.
-
How to Use
Enter analysis periods (quarters, years, or departments) in the dark blue header row. Input revenue, expense, and profit data in the numeric fields of each row. Use the total row to emphasize cumulative results and apply color highlighting to draw attention to key financial metrics.
-
Recommended For
CFOs, financial analysts, executives, and investor relations professionals presenting financial reports, quarterly earnings, investor pitches, board meetings, and financial performance reviews.
-
Slide Structure
2-slide template with 6-column table format on each slide. Header row features dark blue background with 'Stylish Design' label. Data rows alternate between light blue and gray backgrounds, each containing category labels and six numeric input fields (0.00 format). Total row at bottom summarizes cumulative figures.
Related Products
-

Business Income Statement Slide – Table for Financial Clarity
#Financial Plans and Performance #Diagram #Income Statement
-

Sales and Profit Calculation Table – Efficient Profit Management
#Financial Plans and Performance #Diagram #Income Statement
-

Table of Contents for Business Success – Financial Planning and Performance
#Financial Plans and Performance #Diagram #Income Statement
-

Sales and Profit Analysis Chart – An Effective Tool for Financial Performance
#Financial Plans and Performance #Diagram #Income Statement
