Oriental Medicine Component Circle Graph – Accurate Visualization of Market and Products
RJ0700011_6
- Last Update 07/25/2025
- File Size 0.3MB
- # of Slides 2
- File Format PPTX
- Slide Ratio 16:9
- Color
Keywords
- #Content-Based Slides
- #Design-Based Slides
- #Product/Service Introduction
- #Market and Competitor Analysis
- #Graph
- #Composition
- #Market Analysis
- #Circles
- #Doughnut Chart
- #16:9
- #donut chart PowerPoint slide
- #4-segment pie chart template
- #ratio visualization PowerPoint
- #circular graph presentation
- #data chart slide design
About the Product
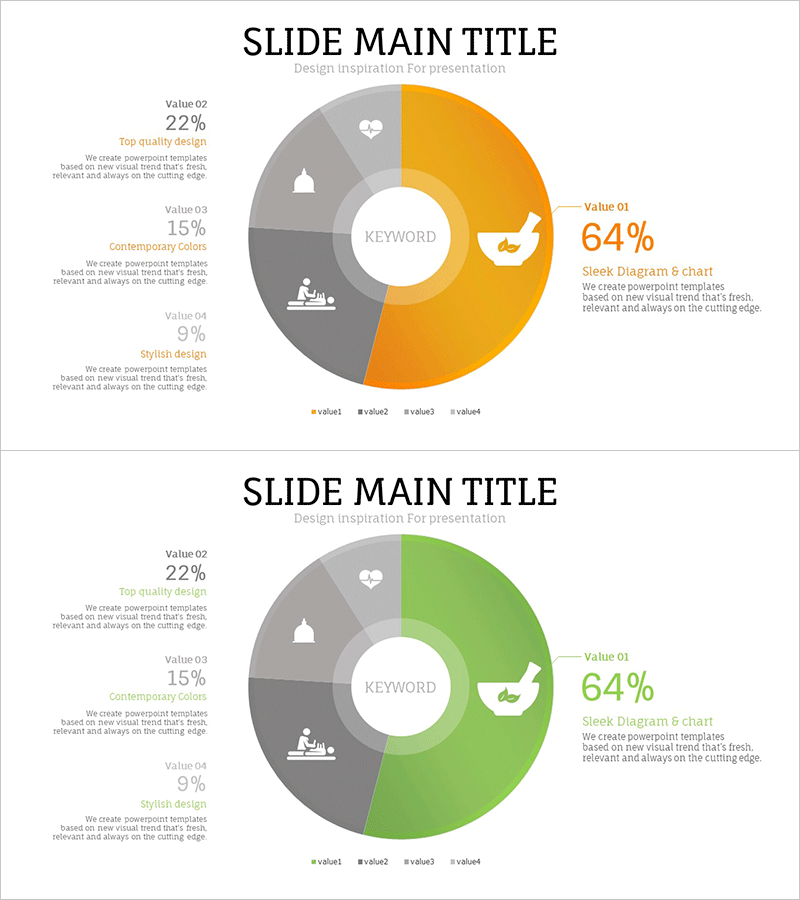
A 4-segment donut chart PowerPoint slide that emphasizes a central keyword while displaying comparative data. Designed in gold and gray dual-tone colors, this slide effectively visualizes market share, product composition, sales distribution, and customer segmentation. Each segment includes an icon and descriptive text for enhanced clarity. Two color variations (gold-accent and green-accent) allow you to select the version that best matches your presentation context. Available in 16:9 widescreen PPTX format, fully editable and ready to use immediately.
Usage Points
-
Main Usage
Visualize proportional data across four categories—market share, product components, sales channels, or customer segments—with a central keyword emphasis. The donut structure allows you to highlight a core message in the center, increasing data credibility in reports, proposals, and marketing presentations.
-
How to Use
Replace the text and numerical values in each segment with your own data. Adjust colors as needed to match your brand or presentation theme. The gold-accent version emphasizes premium positioning, while the green-accent version conveys growth and positive messaging. Customize fonts and icons via the slide master.
-
Recommended For
Marketing managers, product planners, sales directors, executives preparing reports, consultants, and market analysis teams. Particularly valuable for industries requiring product composition explanation—oriental medicine, health supplements, medical devices, and consumer goods.
-
Slide Structure
Slide 1: Gold-accent donut chart (4 segments, central keyword area, 4 text boxes on left). Slide 2: Green-accent donut chart (identical structure, color variation). Icons placed in each segment with legend included.
Related Products
-

Rocket Research Progress Pie Chart – Market and Service Analysis
#Product/Service Introduction #Market and Competitor Analysis #Graph
-

Donut Slide Visualizing COVID-19 Virus Types
#Product/Service Introduction #Market and Competitor Analysis #Graph
-

Comparative Analysis of Composition Contents Pie Chart – Market and Competitor Analysis
#Product/Service Introduction #Market and Competitor Analysis #Graph
-

Conveying Design Inspiration with Circular Diagram – Visually Appealing Presentation
#Product/Service Introduction #Market and Competitor Analysis #Graph
