Conveying Design Inspiration with Circular Diagram – Visually Appealing Presentation
RJ0300080_25
- Last Update 05/11/2025
- File Size 0.9MB
- # of Slides 2
- File Format PPTX
- Slide Ratio 16:9
- Color
Keywords
- #Content-Based Slides
- #Design-Based Slides
- #Product/Service Introduction
- #Market and Competitor Analysis
- #Graph
- #Composition
- #Market Analysis
- #Circles
- #Doughnut Chart
- #16:9
- #donut pie chart PowerPoint
- #pie chart slide template
- #ratio visualization diagram
- #circular chart presentation
- #graph PowerPoint slide design
About the Product
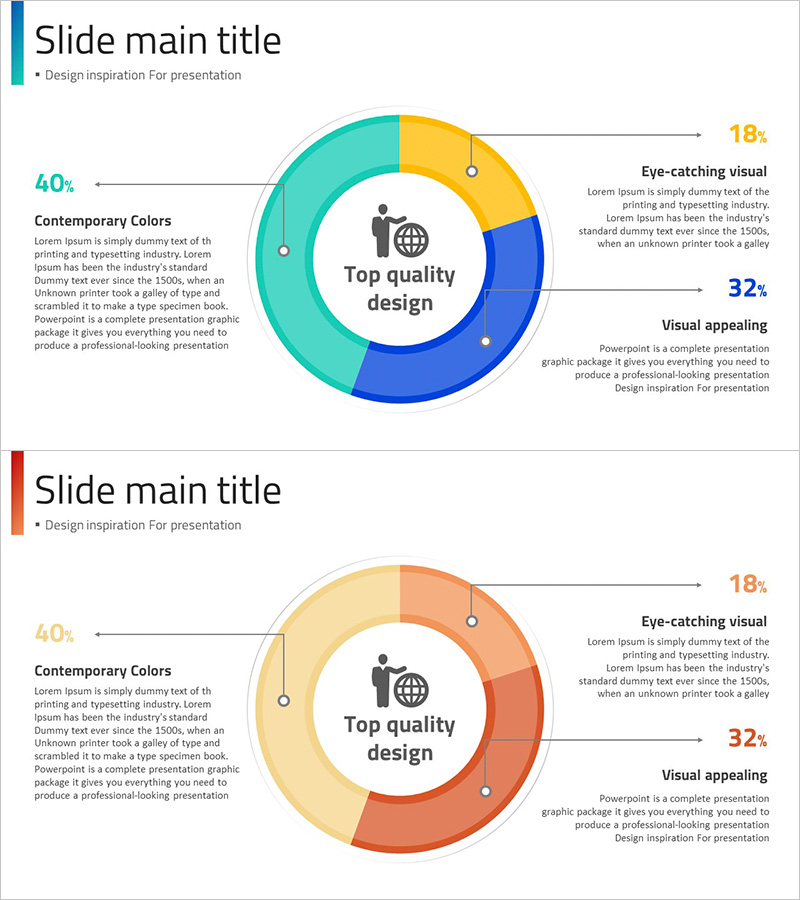
A donut-shaped pie chart PowerPoint slide with a centered icon and three-segment data visualization. The design uses turquoise, yellow, and blue color segments with percentage values and descriptive text connected by arrow lines for clear information delivery. The 2-slide set includes an alternative color combination in beige, orange, and red, allowing you to match your presentation theme and brand colors. This editable PPT template is ready for immediate use in presentations, reports, and slide decks.
Usage Points
-
Main Usage
Visualize ratio, composition, and market share data using a donut-shaped pie chart. The centered icon and surrounding percentage segments emphasize key information, making it ideal for marketing, strategy, and performance reporting sections to communicate market share, customer composition, and budget allocation.
-
How to Use
Edit each segment's color and percentage values to match your data, then replace the centered icon with an image relevant to your topic. Add item names and descriptions to the arrow text boxes to complete the slide. Choose between the two color combinations to align with your presentation's visual tone.
-
Recommended For
Marketing professionals, planners, analysts, and executives presenting market analysis, customer segmentation, budget allocation, and performance metrics. Ideal for business reports, marketing plans, strategy presentations, and investor pitch decks.
-
Slide Structure
2-slide set, each featuring a donut pie chart with a centered icon divided into 3 segments. Each segment displays percentage values (40%, 32%, 18%, etc.) with arrow-connected text boxes for item names and descriptions. Slide 1 uses turquoise, yellow, and blue; Slide 2 offers beige, orange, and red color combinations.
Related Products
-

Security Business Composition Pie Chart – Market and Competitor Analysis
#Product/Service Introduction #Market and Competitor Analysis #Graph
-

Medical System Configuration Graph – Infographic for Market Analysis
#Product/Service Introduction #Market and Competitor Analysis #Diagram
-

Science Experiment Analysis Circle Graph – Market and Service Introduction
#Product/Service Introduction #Market and Competitor Analysis #Graph
-

Donut Slide Visualizing COVID-19 Virus Types
#Product/Service Introduction #Market and Competitor Analysis #Graph
