Business Task Analysis Pie Chart – Effective Market Analysis
RJ0300051_5
- Last Update 05/02/2025
- File Size 2.9MB
- # of Slides 2
- File Format PPTX
- Slide Ratio 16:9
- Color
Keywords
- #Content-Based Slides
- #Design-Based Slides
- #Product/Service Introduction
- #Market and Competitor Analysis
- #Graph
- #Composition
- #Market Analysis
- #Circles
- #Doughnut Chart
- #16:9
- #doughnut chart PowerPoint slide
- #pie chart presentation template
- #ratio analysis chart
- #data visualization PPT
- #donut graph slide design
About the Product
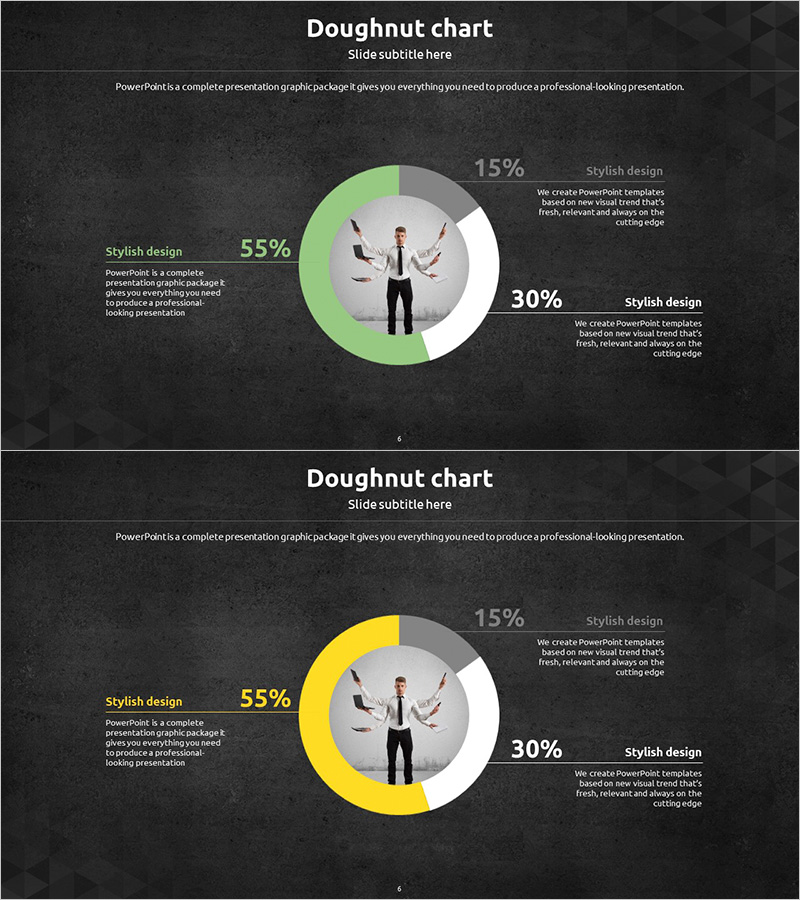
A professional doughnut chart PowerPoint slide designed to visualize business data with clarity and impact. The dark background features a three-segment donut chart in green, yellow, and gray tones that effectively displays proportional data. A central image area allows you to place photos or icons, making it ideal for market analysis, task distribution, customer segmentation, and competitive insights. The 2-slide set provides consistent layouts that can be used for multiple datasets or color variations. Each segment is clearly labeled with percentage values and accompanying text descriptions, enabling immediate use in business presentations without extensive editing.
Usage Points
-
Main Usage
Clearly present business data composition using a doughnut chart format. Ideal for comparing three key metrics such as market share, task allocation, customer demographics, or budget distribution. The central image area emphasizes core messages or representative visuals, enhancing audience engagement and data comprehension.
-
How to Use
Double-click the chart values to input your actual data. Each segment color can be independently modified to match your brand or presentation theme. Insert photos, icons, or logos in the central image area to reinforce your message. Edit text descriptions to align with your specific presentation content and audience needs.
-
Recommended For
Marketing professionals presenting market analysis, executives reporting business performance, sales teams analyzing customer segments, planning teams explaining budget allocation, and consultants delivering data-driven proposals. Recommended for any business presentation requiring intuitive visualization of proportional data across three categories.
-
Slide Structure
Two-slide set featuring identical doughnut chart layouts. Each slide displays a dark background with a 3-segment donut chart (green 55%, yellow or gray 15%, gray or white 30%), a central circular image placeholder, and left-right text description boxes. Formatted in 16:9 widescreen ratio for compatibility with modern presentation environments.
Related Products
-

Science Experiment Analysis Circle Graph – Market and Service Introduction
#Product/Service Introduction #Market and Competitor Analysis #Graph
-

Rocket Research Progress Pie Chart – Market and Service Analysis
#Product/Service Introduction #Market and Competitor Analysis #Graph
-

Health Checkup Data Analysis Circular Graph – Effective Business Data Visualization
#Product/Service Introduction #Market and Competitor Analysis #Diagram
-

Visualizing Genetic Research Data with a Donut Chart
#Product/Service Introduction #Market and Competitor Analysis #Diagram
