Herbal Medicine Usage Analysis Graph – Practical Template for Market Analysis
RJ0700011_16
- Last Update 07/24/2025
- File Size 1.9MB
- # of Slides 2
- File Format PPTX
- Slide Ratio 16:9
- Color
Keywords
About the Product
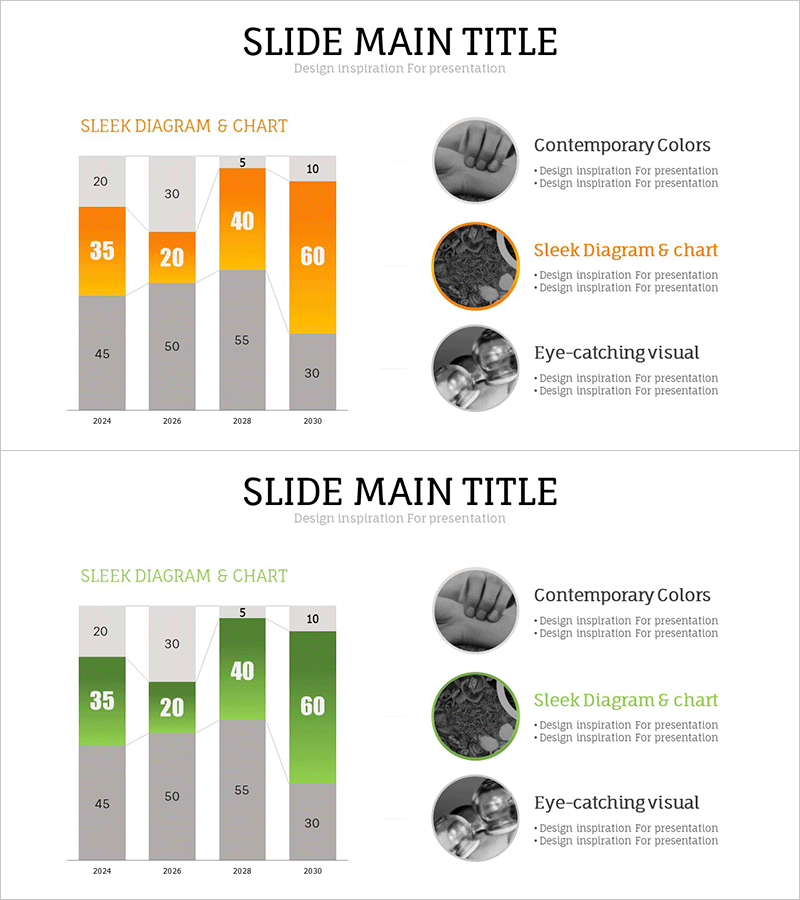
A stacked bar chart PowerPoint slide that visualizes year-over-year data changes from 2024 to 2030. Each bar is divided into multiple segments in orange and gray tones, simultaneously displaying both total values and compositional ratios. This presentation template is ready to use for market analysis, business performance reports, and product sales tracking. The 2-slide set includes both orange and green color versions, allowing you to select the design that matches your brand identity and presentation theme.
Usage Points
-
Main Usage
This stacked bar chart slide displays numerical changes and compositional ratios across four years (2024–2030) simultaneously. It is optimized for presenting quantitative data on market size trends, product sales analysis, and departmental business performance comparisons with strong visual impact.
-
How to Use
Input actual figures into each segment of the bars for immediate use. The orange version suits warm-toned presentations emphasizing growth, while the green version highlights stability and positive momentum. Customize the title, legend, and axis labels to match your specific analysis topic and data context.
-
Recommended For
Marketing managers, planning teams, financial analysts, and sales directors benefit from this template when presenting quarterly or annual performance reports and market analysis. It is essential for business plans, investor pitch decks, marketing strategy documents, and business status reports that rely on quantitative data.
-
Slide Structure
2-slide set. Each slide features 4 year-labeled bars (2024, 2026, 2028, 2030), with each bar divided into 3–4 stacked segments. Layout includes title area at top, Y-axis values on left, X-axis years at bottom, and legend with descriptive text on the right side.
Related Products
-

Medical Services Characteristics Connection Diagram
#Market and Competitor Analysis #Graph #Customer Analysis
-

Visualization of Learning Response Data – Market Trend Analysis
#Market and Competitor Analysis #Graph #Future Outlook
-

Business Market Analysis Segmented Vertical Bar Graph
#Business Introduction #Market and Competitor Analysis #Graph
-

Tablet PC Mockup Vertical Bar Graph – Market Analysis and Tech Insights
#Business Introduction #Market and Competitor Analysis #Graph
