Excellent Industry Analysis Table – Insights on Technological Trends
RJ0700010_29
- Last Update 07/24/2025
- File Size 0.8MB
- # of Slides 2
- File Format PPTX
- Slide Ratio 16:9
- Color
Keywords
- #Content-Based Slides
- #Design-Based Slides
- #Business Introduction
- #Market and Competitor Analysis
- #Diagram
- #Technological Status
- #Market Analysis
- #Table
- #16:9
- #industry analysis table PowerPoint
- #comparison analysis slide
- #technology trends table PPT
- #market analysis presentation
- #two-column comparison layout slide
About the Product
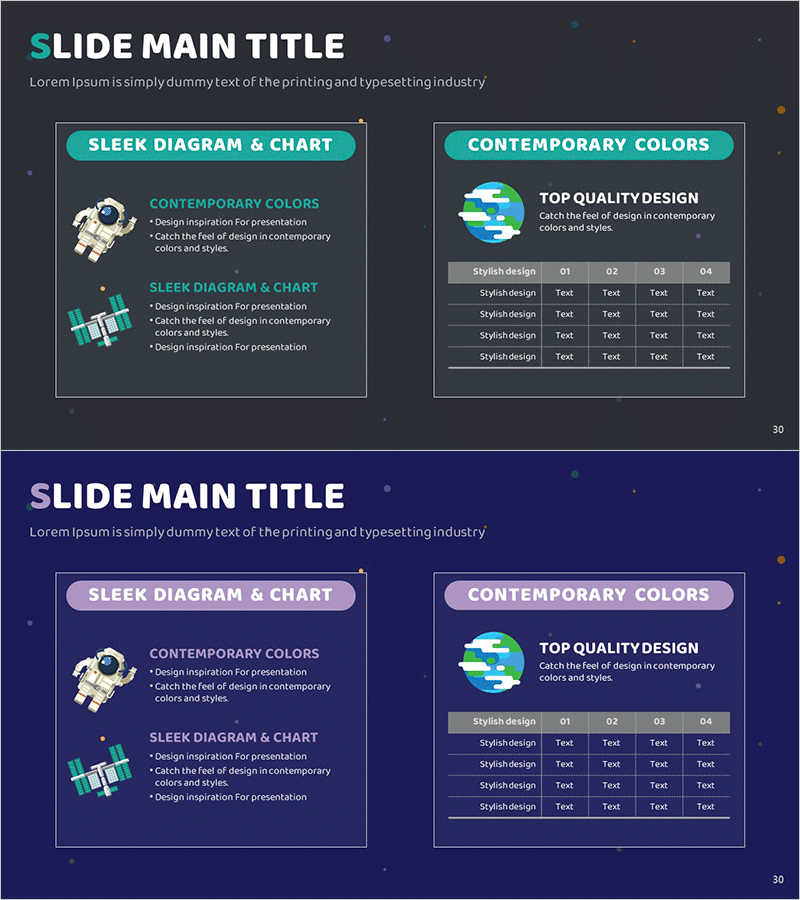
A 2-slide PowerPoint presentation designed to compare industry analysis and technological trends at a glance. Features a teal background with white typography and a dual-column layout: left side displays icons with descriptive text, while the right side provides a structured data table for input. Ideal for market research reports, technology trend analysis, and industry overview presentations where complex information needs clear visual organization. Each slide functions independently and maintains consistent design language throughout your presentation deck.
Usage Points
-
Main Usage
Visualize complex industry data, technology comparisons, and market trends using a structured table format that enhances audience comprehension. The clear separation between left icon area and right data table creates effective information hierarchy and visual balance.
-
How to Use
Enter key concepts or category names in the left icon section, then populate the right table with comparison items and numerical data. Use in market research reports, technology briefings, and industry overview sections to deliver data-driven, credible presentations with professional visual structure.
-
Recommended For
Marketing professionals, technology strategists, market analysts, and business development executives presenting industry analysis, competitive comparisons, and technology roadmaps. Particularly effective for investor presentations, business plan pitches, and market entry strategy meetings requiring data-backed decision support.
-
Slide Structure
2-slide set with each slide divided into left icon area (1 text input zone) and right table area (4 rows × 4 columns data cells). Teal header and gray data cells provide clear visual distinction for information priority, optimized for 16:9 widescreen format.
Related Products
-

Big Data Comprehensive Analysis Chart – Insights for Market Analysis
#Business Introduction #Market and Competitor Analysis #Diagram
-

Goal Setting & Radial Graph – Intuitive Data Visualization
#Business Introduction #Market and Competitor Analysis #Diagram
-

Green Yellow Data Analysis Chart – Market and Competitive Analysis
#Business Introduction #Market and Competitor Analysis #Diagram
-

Service Technology Analysis Circle Graph – Market Analysis and Technology Status
#Business Introduction #Market and Competitor Analysis #Diagram
