Comparative Analysis Vertical Chart – Market and Competitor Analysis
RJ0300096_13
- Last Update 05/16/2025
- File Size 2.2MB
- # of Slides 2
- File Format PPTX
- Slide Ratio 16:9
- Color
Keywords
- #Content-Based Slides
- #Design-Based Slides
- #Market and Competitor Analysis
- #Graph
- #Competitor Analysis
- #Market Analysis
- #Column
- #Grouped Column
- #16:9
- #vertical bar chart PowerPoint
- #clustered bar graph template
- #comparative analysis slide
- #market analysis chart
- #competitor analysis PowerPoint
- #dual-series chart download
About the Product
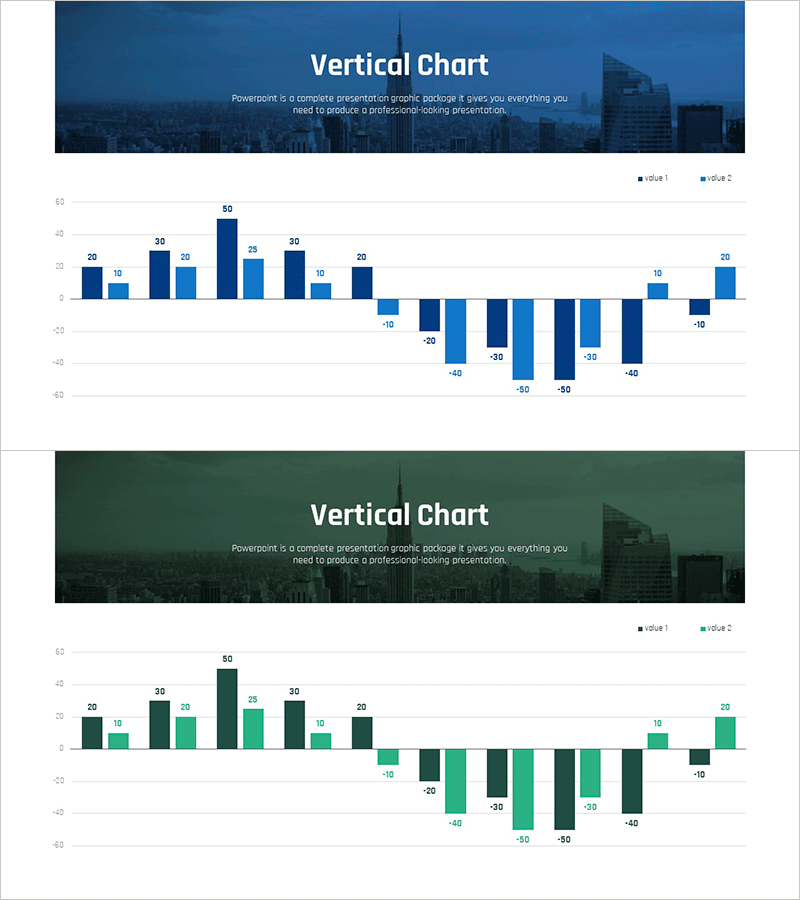
A clustered vertical bar chart PowerPoint slide optimized for market analysis and competitive benchmarking. Designed with blue and green color schemes to visually contrast two data series side by side. The vertical bar graph supports both positive and negative values, accommodating up to 15 data points per series. Each item displays two bars in parallel, enabling instant comparison for performance metrics, market share analysis, competitor benchmarking, and business intelligence. The 16:9 widescreen format includes 2 slides ready for immediate insertion into presentations.
Usage Points
-
Main Usage
Enables simultaneous comparison of two data series for market analysis, competitive benchmarking, and performance evaluation. Supports both positive and negative values, making it ideal for visualizing growth trends, profit/loss analysis, target vs. actual performance, and other business metrics requiring dual-axis comparison.
-
How to Use
Input data values for each item and bar heights adjust automatically. Two color-coded series (blue and green) display side by side for intuitive comparison. Insert into business reports, marketing plans, and investor presentations to support data-driven decision-making in analysis sections.
-
Recommended For
Executives, marketing professionals, business analysts, and consultants requiring data-driven presentations. Ideal for quarterly performance reports, market research presentations, competitive strategy meetings, investor briefings, and any quantitative analysis-focused presentation requiring clear dual-series visualization.
-
Slide Structure
2-slide set featuring vertical bar charts with 15 data points each. Each item displays two clustered bars (blue for series 1, green for series 2) positioned side by side. Zero baseline divides positive (upper) and negative (lower) regions to clearly show growth and decline trends. Includes legend, axis labels, and data value annotations.
Related Products
-

Comparative Analysis of Vertical Bar Bundles
#Market and Competitor Analysis #Graph #Competitor Analysis
-

Layout Design Presentation Template - Column Charts
#Market and Competitor Analysis #Graph #Competitor Analysis
-

Pill Market Analysis Vertical Bar Graph – Clear Visualization of Market Status
#Market and Competitor Analysis #Graph #Competitor Analysis
-

Marketing and Analysis Presentation Template – Professional Data Visualization Design
#Market and Competitor Analysis #Graph #Competitor Analysis
