Global Trend Analysis Bar Graph – Market and Competitive Analysis
RJ0700009_18
- Last Update 07/24/2025
- File Size 1.9MB
- # of Slides 2
- File Format PPTX
- Slide Ratio 16:9
- Color
Keywords
- #Content-Based Slides
- #Design-Based Slides
- #Market and Competitor Analysis
- #Graph
- #Competitor Analysis
- #Column
- #Grouped Column
- #16:9
- #grouped bar chart PowerPoint
- #market analysis slide template
- #competitive comparison graph
- #data visualization PPT
- #bar graph template download
- #business analysis presentation
About the Product
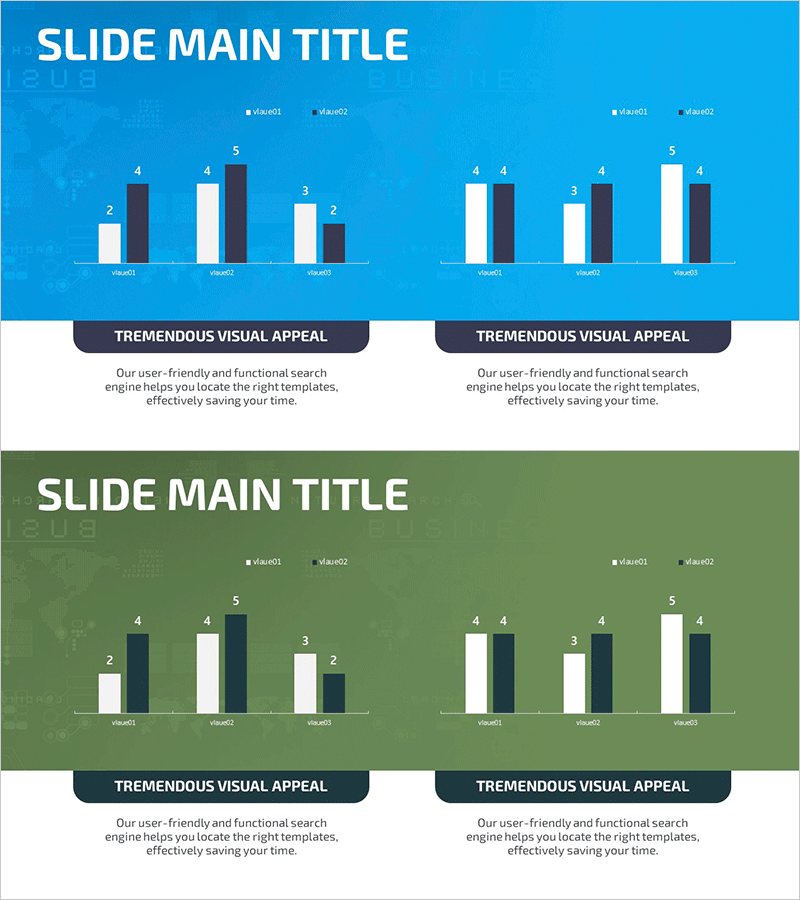
A grouped bar chart PowerPoint slide designed for market analysis and competitive comparison. The slide features a bright blue background with white and dark-colored bars that clearly contrast data values. The 2-slide set displays 6 metrics across two layouts—3 items on the left, 3 on the right—with each item containing 2 data series (data01 and data02) for direct numerical comparison. This design effectively visualizes market positioning and competitive benchmarking in presentations, reports, and strategic planning documents. The 16:9 widescreen PPTX format is ready for immediate editing and customization.
Usage Points
-
Main Usage
This slide enables simultaneous comparison of multiple market indicators—such as market size, growth rate, and market share—while clearly positioning your company against competitors. The grouped bar structure places different data series side-by-side for intuitive numerical comparison and trend identification.
-
How to Use
Use in business strategy presentations, investor pitch decks, quarterly performance reports, and marketing planning documents during the market analysis section. Bar height and color differentiate data magnitude and categories, while the legend (data01, data02) clearly identifies each series for audience clarity.
-
Recommended For
Ideal for executives, planning teams, marketing departments, and sales teams presenting market conditions and competitive landscapes. Effective for quantitative data-driven strategy meetings, stakeholder reporting, internal training sessions, and board-level decision-making discussions.
-
Slide Structure
2-slide set. Each slide displays 3 metrics (value01, value02, value03) in left-right layout with 2 grouped bars per metric. Top legend identifies data series; bottom text area accommodates analysis notes. 16:9 widescreen format with editable elements.
Related Products
-

Earth Analysis Bundle Vertical Bar Graph – Market and Competitor Analysis
#Market and Competitor Analysis #Graph #Competitor Analysis
-

Eco-friendly Vertical Bar Graph in Blue and Yellow
#Market and Competitor Analysis #Graph #Competitor Analysis
-

Infographic Slide Highlighting Visualized Data – Modern Design
#Market and Competitor Analysis #Graph #Competitor Analysis
-

PC Mockup & Column Bundle Graph
#Market and Competitor Analysis #Graph #Other
