Linkage Loop Diagram – Explaining Business Fields and Areas
RM0400010_23
- Last Update 02/17/2025
- File Size 0.3MB
- # of Slides 2
- File Format PPTX
- Slide Ratio 16:9
- Color
Keywords
- #Content-Based Slides
- #Design-Based Slides
- #Company Introduction
- #Business Introduction
- #Diagram
- #Business Areas
- #Business Areas
- #Cluster
- #Spread
- #Chain Diagram
- #Centralized Diagram
- #16:9
- #central diagram PowerPoint
- #linkage loop slide template
- #8-node cluster diagram
- #business structure PPT
- #organizational relationship diagram
About the Product
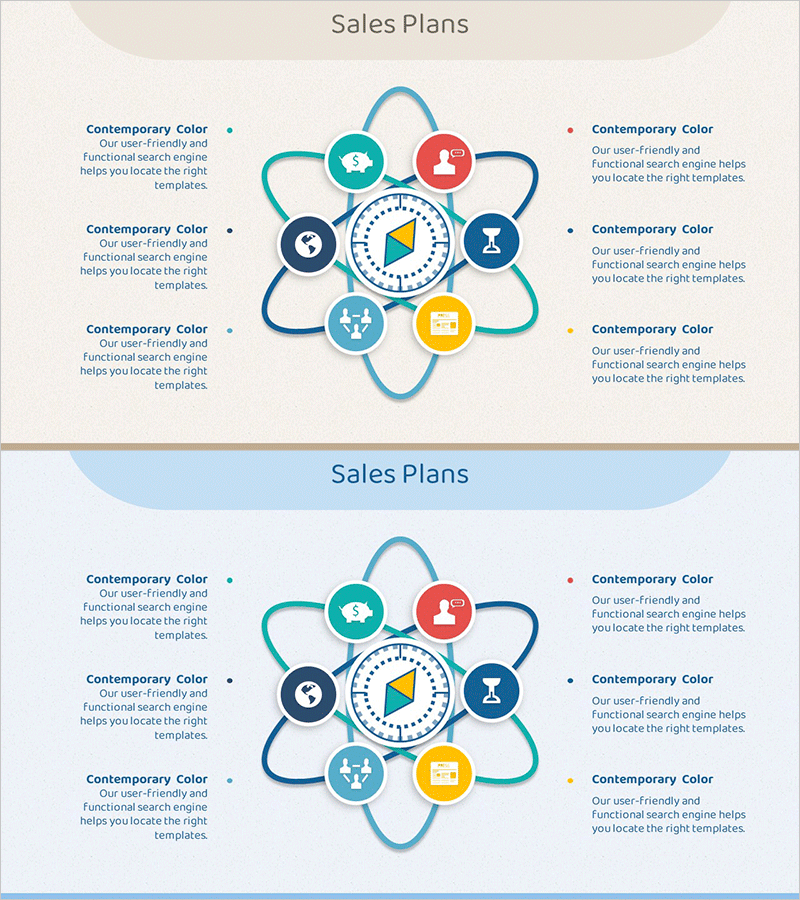
A cluster diagram PowerPoint slide featuring a central diamond icon surrounded by 8 nodes connected with smooth curved lines. Each node represents a business field, operational area, or functional department, with the central icon symbolizing core value or strategic focus. The design uses teal, blue, red, and yellow circular nodes with soft connecting curves to visualize interdependencies. Each node includes an icon placeholder and text area for department names, roles, or objectives. The 2-slide set offers contrasting backgrounds (beige and light blue) for flexible presentation contexts. Delivered as a 16:9 widescreen PPTX file, fully editable and ready for immediate use.
Usage Points
-
Main Usage
Clearly express the interconnected relationships between core organizational values, strategy, and related departments, business areas, or functions. Ideal for company overviews, business structure explanations, organizational restructuring announcements, and strategic planning sessions where complex relationships need intuitive visual communication.
-
How to Use
Enter core values, strategic focus, or objectives in the central diamond icon. Fill the 8 surrounding nodes with department names, business areas, or functional roles. Customize node colors and icons to match organizational branding. Select background color based on presentation context—beige for formal presentations, light blue for internal meetings.
-
Recommended For
Executive teams and strategy departments presenting organizational structure and business portfolios. Marketing teams visualizing customer touchpoints and channel relationships. New employee onboarding and company overview sessions to enhance organizational understanding. Consulting and proposal presentations for client business ecosystem analysis.
-
Slide Structure
1 central diamond icon + 8 circular nodes positioned at cardinal and intercardinal points (top, top-left, left, bottom-left, bottom, bottom-right, right, top-right). Each node features distinct color coding (teal, blue, red, yellow) with icon placeholder and text input area. Smooth curves connect all nodes to center. 2-slide layout with beige and light blue background options.
Related Products
-

Business Area Diffusion Diagram – Connection and Cluster
#Company Introduction #Business Introduction #Diagram
-

Cooperative Partner Business Areas Diagram
#Company Introduction #Business Introduction #Diagram
-

Core Value-Centric Circular Strategy – The Future of Business
#Company Introduction #Business Introduction #Diagram
-

Business Area Flower Diagram – Ideal for Company Introductions
#Company Introduction #Business Introduction #Diagram
