Security Business Composition Pie Chart – Market and Competitor Analysis
RJ0300077_6
- Last Update 05/10/2025
- File Size 1.1MB
- # of Slides 2
- File Format PPTX
- Slide Ratio 16:9
- Color
Keywords
- #Content-Based Slides
- #Design-Based Slides
- #Product/Service Introduction
- #Market and Competitor Analysis
- #Graph
- #Composition
- #Market Analysis
- #Circles
- #Doughnut Chart
- #16:9
- #donut chart PowerPoint slide
- #pie chart template
- #business data visualization
- #ratio diagram PPT
- #how to create donut chart in PowerPoint
About the Product
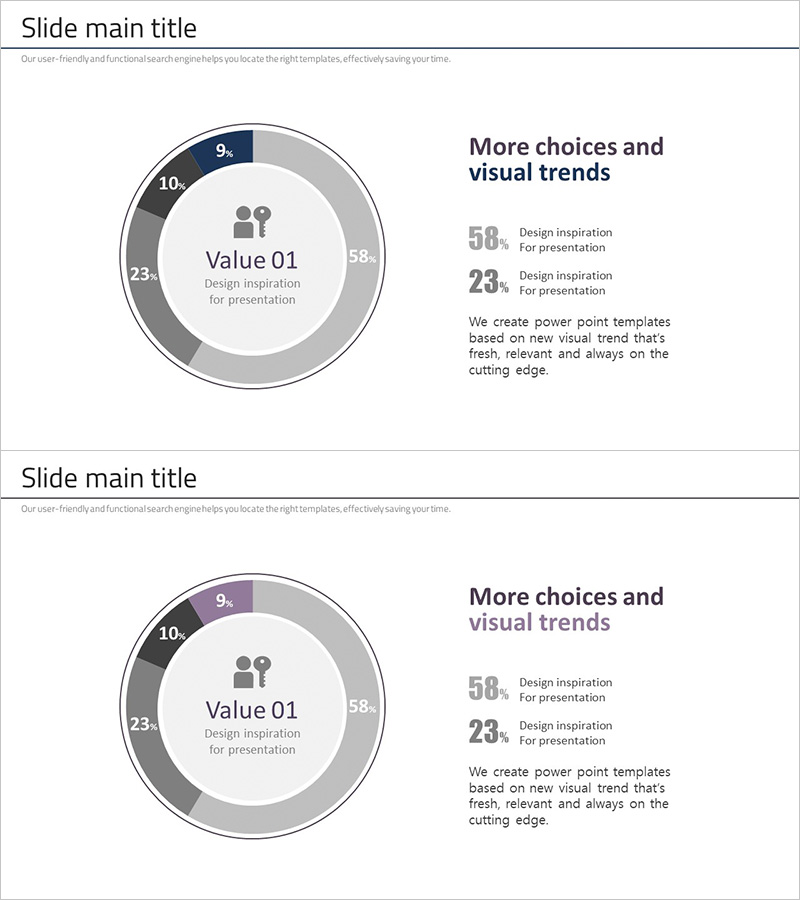
A professional donut chart PowerPoint slide designed to visualize business data with clarity and impact. The design features a central hub displaying a key metric or icon, surrounded by an outer ring divided into 4 segments showing percentage values and labels. This structure is ideal for market analysis, competitor comparison, and business composition breakdown. The color palette combines dark blue, gray, and white tones, conveying professionalism and trust suitable for corporate presentations. With 2 slides provided in different color variations, you can maintain visual consistency while highlighting different data points. Perfect for technology, finance, and security sectors presenting business performance and market positioning.
Usage Points
-
Main Usage
Enables clear comparison of 4 data categories by displaying their relative proportions in a single visual. The central area accommodates a key metric, title, or icon, while the outer ring segments display percentages and descriptive labels. Supports data-driven decision-making in business presentations.
-
How to Use
Integrate into business proposals, strategic plans, and investor pitch decks within market analysis or competitive landscape sections. Edit segment percentages and labels to reflect actual data, and customize colors to emphasize key information. Use both slides to show comparative analysis or different data sets while maintaining design consistency.
-
Recommended For
Ideal for executives, marketing professionals, and strategic planning teams in technology, finance, security, and telecommunications sectors. Particularly effective when presenting market share, customer composition, revenue breakdown, or product portfolio distribution to stakeholders.
-
Slide Structure
2-slide set featuring identical donut chart designs in dark blue and purple color variations. Each slide contains a central circular hub (Value 01 + icon placeholder) and an outer ring divided into 4 segments (labeled 9%, 10%, 23%, 58%), with a legend and descriptive text area positioned on the right side.
Related Products
-

Market Segmentation Donut Chart – The Art of Data Visualization
#Product/Service Introduction #Market and Competitor Analysis #Graph
-

Conveying Design Inspiration with Circular Diagram – Visually Appealing Presentation
#Product/Service Introduction #Market and Competitor Analysis #Graph
-

Medical System Configuration Graph – Infographic for Market Analysis
#Product/Service Introduction #Market and Competitor Analysis #Diagram
-

Visualizing Genetic Research Data with a Donut Chart
#Product/Service Introduction #Market and Competitor Analysis #Diagram
