Future Outlook Vertical Bar Graph – Market Analysis
RJ0700012_10
- Last Update 07/25/2025
- File Size 1.1MB
- # of Slides 2
- File Format PPTX
- Slide Ratio 16:9
- Color
Keywords
- #Content-Based Slides
- #Design-Based Slides
- #Market and Competitor Analysis
- #Graph
- #Future Outlook
- #Market Analysis
- #Column
- #Column Chart
- #16:9
- #vertical bar chart PowerPoint
- #bar graph slide template
- #market analysis chart
- #data comparison slide
- #sales trend visualization
- #how to create bar chart in PowerPoint
About the Product
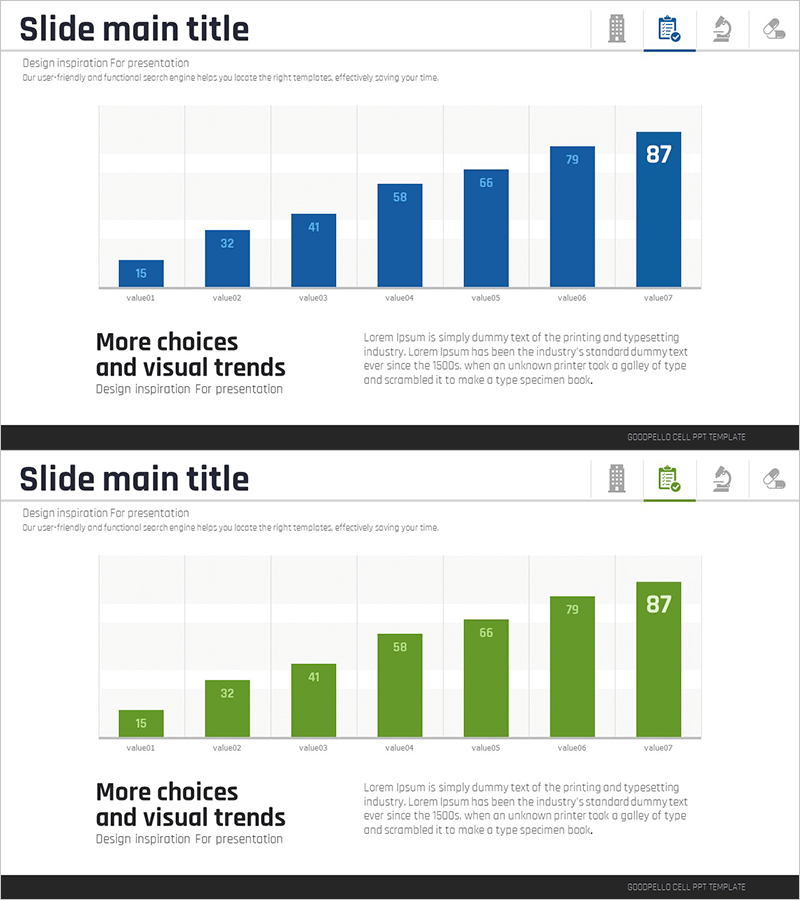
A vertical bar chart PowerPoint slide designed to visualize market analysis and future outlook across seven data points. This presentation template effectively displays comparative metrics such as business performance, market share, and sales trends through ascending bar heights. The deep blue bar series contrasts against a light background to emphasize numerical values, with clear data labels positioned above each bar for precise information delivery. Instantly applicable to business reports, strategic proposals, and investor presentations where quantitative evidence is essential.
Usage Points
-
Main Usage
Visualizes numerical changes across seven sequential data points, enabling direct comparison of market metrics, business performance, and sales progression. The ascending bar structure provides intuitive data comprehension for quantitative evidence presentation.
-
How to Use
Replace numerical labels above each bar with actual data values for immediate deployment. Customize colors, values, and category labels to match presentation context. Insert into business plans, quarterly reports, and market analysis sections of investor decks.
-
Recommended For
Marketing professionals, business strategists, and sales teams presenting market trends, competitive analysis, and revenue performance. Ideal for investor briefings, shareholder reports, and executive decision-making meetings requiring data-driven narratives.
-
Slide Structure
Two-slide layout with identical structure: first slide features seven blue bars, second slide displays seven green bars. Each bar displays numerical values (15–87) as labels, with category identifiers (value01–value07) positioned along the horizontal axis.
Related Products
-

Idea Development Future Outlook Graph – Essential Template for Market Analysis
#Market and Competitor Analysis #Graph #Future Outlook
-

Future Outlook Bar Graph – Visualizing Market Growth
#Market and Competitor Analysis #Graph #Future Outlook
-

Future Outlook Analysis Bar Graph – Essential for Market Analysis
#Market and Competitor Analysis #Graph #Future Outlook
-

Profit Forecast Graph
#Market and Competitor Analysis #Graph #Future Outlook
