Business Meeting Analysis Bar Graph Slide – Market and Competitive Analysis
RJ0300045_5
- Last Update 04/30/2025
- File Size 0.6MB
- # of Slides 2
- File Format PPTX
- Slide Ratio 16:9
- Color
Keywords
- #Content-Based Slides
- #Design-Based Slides
- #Market and Competitor Analysis
- #Graph
- #Future Outlook
- #Market Analysis
- #Column
- #Column Chart
- #16:9
- #horizontal bar chart PowerPoint
- #bar graph presentation slide
- #market analysis chart
- #competitive analysis template
- #business meeting data visualization
- #comparison chart template
About the Product
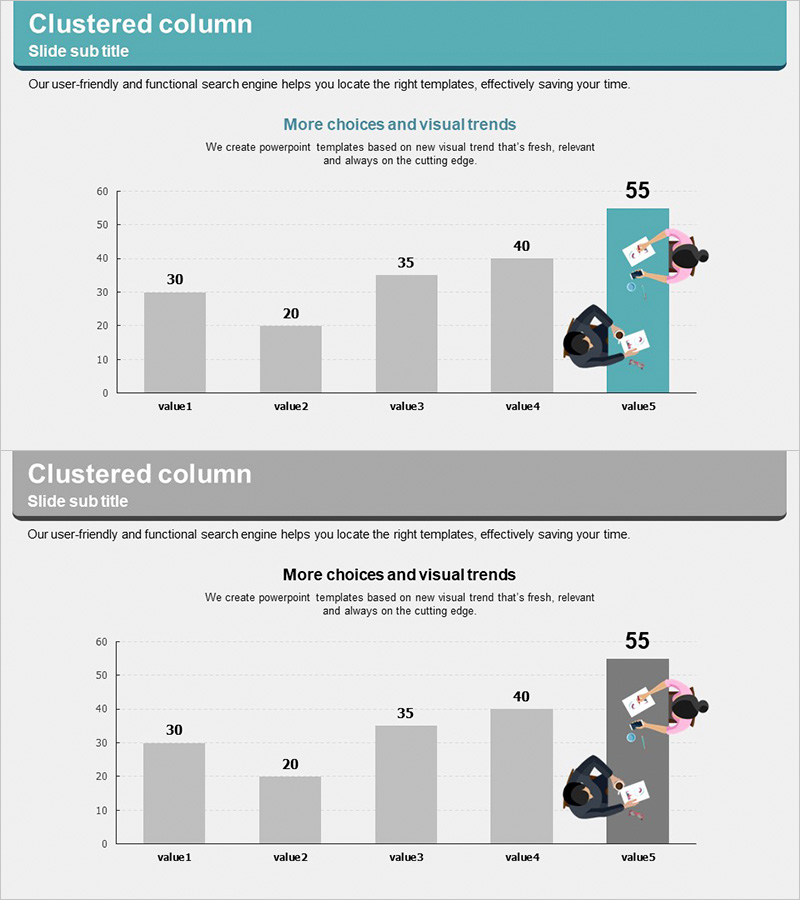
A horizontal bar chart PowerPoint slide optimized for business meetings and strategic presentations. This slide template displays five data items side-by-side, making it ideal for comparing market size, competitor performance, sales figures, customer satisfaction scores, and other key metrics. The design features a teal accent color paired with a gray background to highlight critical data, while an illustration element on the right enhances visual engagement. The two-slide set offers the same data structure in different background colors, providing flexibility for varied presentation flows. Fully editable PPTX format for immediate customization.
Usage Points
-
Main Usage
Designed to compare five data items—such as market size, competitor performance, sales results, or customer satisfaction—in a horizontal layout that instantly reveals relative magnitudes and rankings. Ideal for executive briefings, strategy meetings, and investor presentations where key metrics must be highlighted and compared.
-
How to Use
Replace each bar's numerical value with your own data and update the item labels (value1 through value5) with actual metric names. Use the teal accent bar to highlight the highest value or most important item, and gray bars for comparison data. The illustration element on the right can be removed or replaced with your company logo or custom icons.
-
Recommended For
Marketing professionals, executives, consultants, and analysts presenting market conditions, competitive positioning, or performance comparisons. Suitable for business plans, quarterly reports, investor pitch decks, and strategy meeting materials. Works well for any business presentation requiring five or more data items to be ranked and compared.
-
Slide Structure
Two-slide set with identical data structure but different header backgrounds. The first slide features a teal header with five horizontal bars (value1–value5, values 30, 20, 35, 40, 55) and an illustration element on the right. The second slide presents the same data layout with a gray header background, allowing flexible selection based on presentation flow.
Related Products
-

Market Analysis Comparison Graph – Insights into Future Trends
#Market and Competitor Analysis #Graph #Future Outlook
-

Data Visualization through Vertical Bar Graph – Effective Presentation
#Market and Competitor Analysis #Graph #Future Outlook
-

A Bar Graph Showing Future Prospects
#Market and Competitor Analysis #Graph #Future Outlook
-

Future Outlook Analysis Bar Graph – Essential for Market Analysis
#Market and Competitor Analysis #Graph #Future Outlook
