Competitor Analysis Broken Line Graph
RJ0300033_15
- Last Update 04/27/2025
- File Size 1.3MB
- # of Slides 2
- File Format PPTX
- Slide Ratio 16:9
- Color
Keywords
- #Content-Based Slides
- #Design-Based Slides
- #Market and Competitor Analysis
- #Graph
- #Competitor Analysis
- #Market Analysis
- #Line
- #Line Chart
- #16:9
- #broken line chart PowerPoint
- #competitor analysis slide
- #trend comparison template
- #market analysis graph
- #monthly data visualization
- #line chart PowerPoint download
About the Product
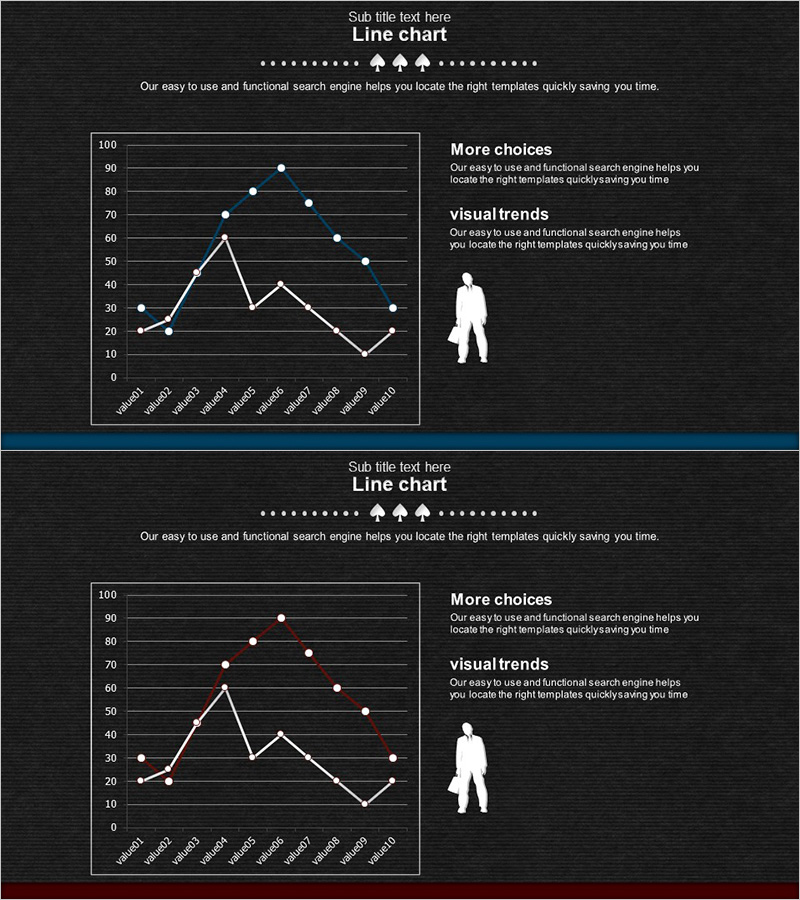
A PowerPoint slide featuring a broken line chart that visualizes competitor performance over time. The dark background with white and blue line series clearly displays monthly trend changes across a 12-month period. Two data series enable direct comparison of performance metrics, with Y-axis scale (0-100) and X-axis monthly labels supporting accurate data interpretation. The right section accommodates 'More choices' and 'visual trends' content areas, making this presentation template immediately applicable to business reports, competitive analysis documents, and marketing strategy presentations.
Usage Points
-
Main Usage
Express competitor revenue, customer count, or market share changes over time using broken line visualization for objective competitive analysis. Two-line series comparison intuitively conveys performance differences between your company and competitors, emphasizing monthly or quarterly trend variations.
-
How to Use
Place this chart in the competitive environment analysis section of executive reports, business plans, or marketing strategy presentations. Modify Y-axis values and X-axis monthly labels with actual data, and customize line colors and data points to match your brand colors.
-
Recommended For
Strategy planning teams, marketing departments, sales teams, and executives use this for competitor performance tracking and market trend analysis. Ideal for quarterly performance reviews, new business feasibility assessments, and pricing strategy development where competitive data visualization is essential.
-
Slide Structure
Two-slide set with identical layout broken line graph slides. Each slide features a left graph area (Y-axis 0-100 scale, X-axis 12-month labels, 2-series lines) and right text area ('More choices' and 'visual trends' sections), unified with dark background and blue accent lines maintaining consistent business tone.
Related Products
-

Competitor Capability Analysis Chart – Efficient Market Analysis
#Market and Competitor Analysis #Graph #Competitor Analysis
-

Medical Experimental Research Data Analysis Slide – Market and Competitor Analysis
#Market and Competitor Analysis #Graph #Competitor Analysis
-

Competitor Analysis Graph for Market Capture
#Market and Competitor Analysis #Graph #Competitor Analysis
-

Black Navy Broken Line Graph Table – Market and Competitor Analysis
#Market and Competitor Analysis #Diagram #Graph
