Space Industry Status Analysis Graph
RJ0700006_18
- Last Update 07/23/2025
- File Size 1.8MB
- # of Slides 2
- File Format PPTX
- Slide Ratio 16:9
- Color
Keywords
About the Product
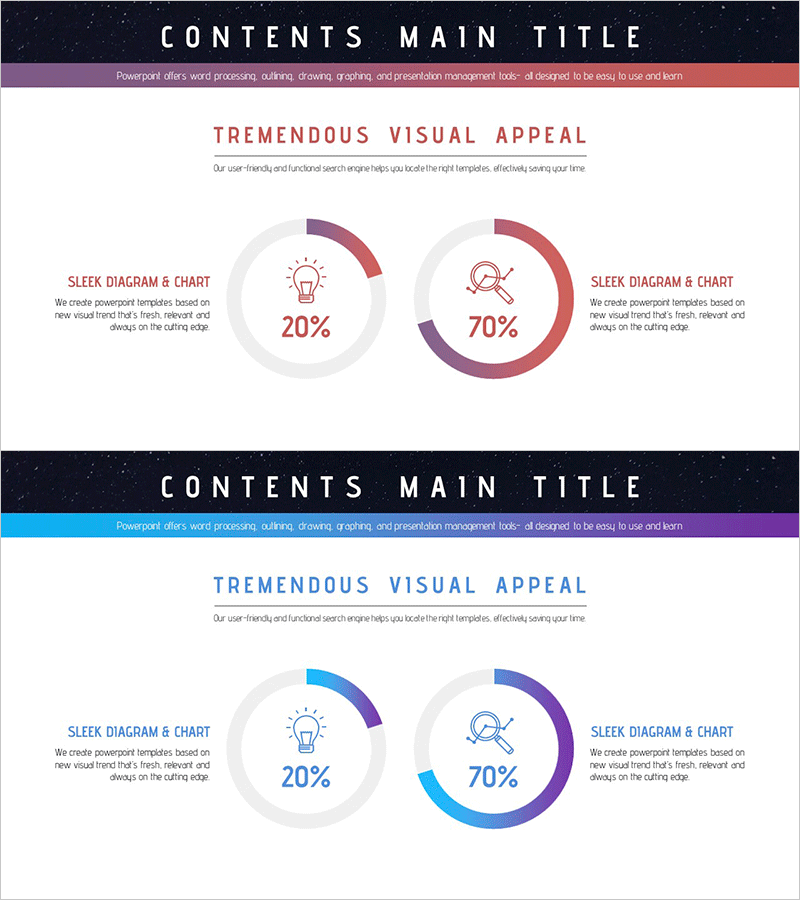
A 2-slide donut chart PowerPoint template featuring gradient purple and pink color tones. The slides visualize two-segment ratio data (20% and 70%) with centered icons that symbolize the data meaning, enabling intuitive communication of key metrics. Ideal for industry status analysis presentations in space, technology, and marketing sectors. Text description areas positioned on both sides allow detailed context alongside ratio visualization. Fully editable and ready to use immediately for your presentation needs.
Usage Points
-
Main Usage
Visualize two-segment ratio data such as market share, composition percentage, or adoption rate using donut chart format. Central icons symbolize the topic while side text areas provide context and interpretation, enhancing audience comprehension of key metrics.
-
How to Use
Apply to business status analysis, market research results, technology adoption rates, customer satisfaction metrics, and similar ratio-based data presentations. Replace slide values and text with your own data, and customize colors and icons to match your presentation theme and corporate branding.
-
Recommended For
Recommended for industry status presentations in space, IT, manufacturing, finance, and marketing sectors. Suitable for executive briefings, investor presentations, business reports, and strategic marketing communications targeting management, employees, clients, and investors.
-
Slide Structure
2-slide set. Each slide contains one donut chart (purple-pink gradient, two-segment ratio display), centered icon, and left-right text description areas. Formatted in 16:9 widescreen ratio for modern presentation environments and seamless compatibility with current display standards.
Related Products
-

Development Status Analysis Comparison Graph – Market Share & Growth
#Product/Service Introduction #Market and Competitor Analysis #Graph
-

Market Share Donut Pie Chart – Insightful Data Visualization
#Product/Service Introduction #Diagram #Graph
-

Composition Donut Circle Graph – Product and Service Introduction
#Product/Service Introduction #Graph #Composition
-

Exercise Objectives Achieved Diagram & Chart – Post-Progress
#Product/Service Introduction #Business Introduction #Diagram
