Current Status of Space Business Visualized with Donut Chart - Competitive Edge Analysis
RJ0700015_11
- Last Update 07/26/2025
- File Size 0.7MB
- # of Slides 2
- File Format PPTX
- Slide Ratio 16:9
- Color
Keywords
About the Product
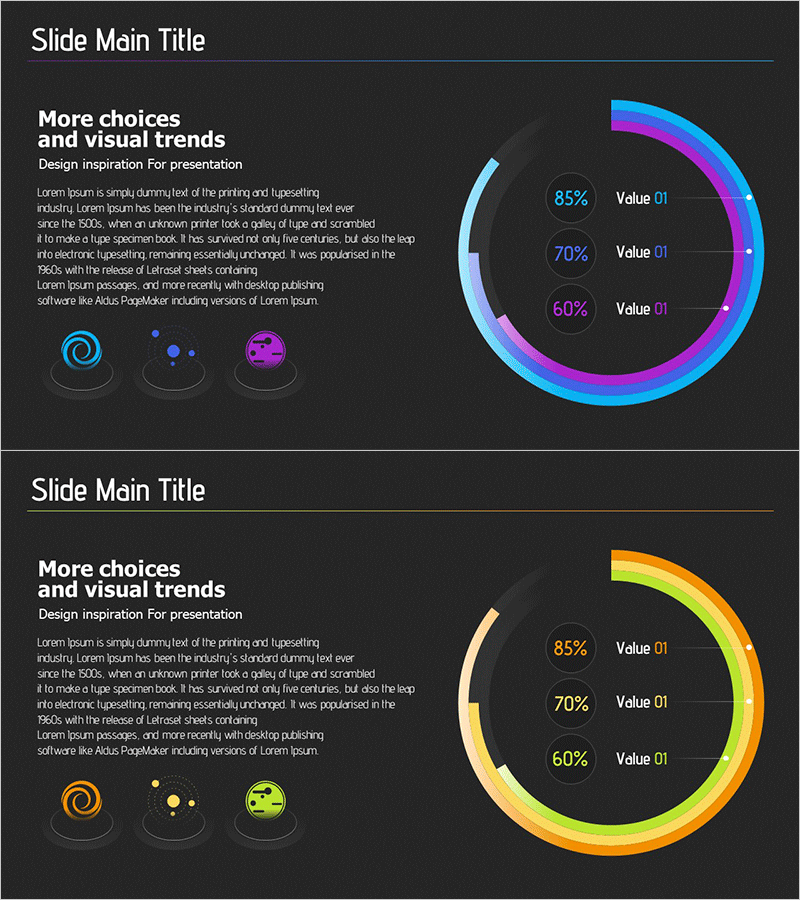
A PowerPoint slide featuring a 3-segment donut chart with cyan, magenta, and yellow gradient colors on a dark background. Each segment displays percentage values (85%, 70%, 60%) and labels to enable intuitive ratio comparison and composition analysis. Three category icons (spiral, dot cluster, sphere) are positioned on the left to reinforce segment differentiation. The 2-slide set supports flexible data adaptation for presentations, reports, and business proposals. Ideal for visualizing competitive analysis, market share, performance metrics, and business status in executive presentations.
Usage Points
-
Main Usage
Enables comparison of 3+ data series through donut chart visualization, allowing stakeholders to grasp composition ratios at a glance. Effectively represents competitive market share, business analysis, performance indicators, and customer satisfaction metrics.
-
How to Use
Deploy in analysis and results sections of business presentations to explain market conditions, competitive positioning, and business performance comparisons. Replace percentage values with actual data and modify left-side icons with category names for immediate use.
-
Recommended For
Recommended for executives, business planners, marketing teams, and sales professionals presenting competitive analysis, market share distribution, departmental performance, and customer segment analysis. Particularly effective in aerospace, advanced technology, IT, and financial sectors where data-driven decision-making is critical.
-
Slide Structure
2-slide set. Each slide features a dark background (#2a2a2a) with center-aligned donut chart (outer diameter 280px, inner diameter 140px), 3 data segments with cyan-magenta-yellow gradient, right-aligned label area (percentage and text), and 3 category icons (spiral, dot cluster, sphere) on the left.
Related Products
-

Cartoon Theme Analysis Donut Circle Graph – Visualizing Market Competitiveness
#Market and Competitor Analysis #Graph #Competitor Analysis
-

Banking Services Sector Analysis Graph – Market and Competitor Analysis
#Market and Competitor Analysis #Graph #Competitor Analysis
-

Doughnut Chart Visualized with Leather Material – Highlighting Competitive Edge
#Market and Competitor Analysis #Graph #Competitor Analysis
-

Global Logistics Competitor Chart
#Market and Competitor Analysis #Diagram #Graph
