Astronomy Theme Bundle Vertical Graph – Market and Competitive Analysis
RJ0700003_27
- Last Update 07/22/2025
- File Size 0.4MB
- # of Slides 2
- File Format PPTX
- Slide Ratio 16:9
- Color
Keywords
About the Product
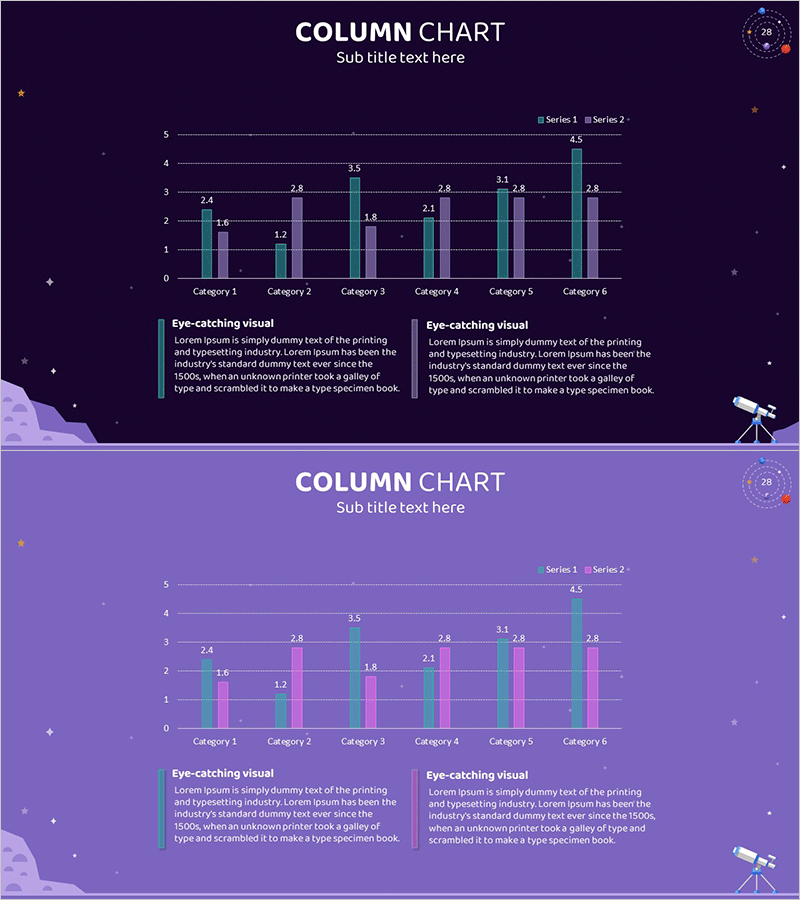
An astronomy-themed grouped vertical bar chart PowerPoint slide featuring dark purple background with teal and pink data series. This slide deck presents 6 categories with 2 data series displayed side-by-side for direct comparison, ideal for market analysis, competitive benchmarking, and sales performance visualization. Each slide includes descriptive text areas below the chart to highlight key insights and findings. The 16:9 widescreen format with 2 slides is ready for immediate editing and presentation use.
Usage Points
-
Main Usage
Enables side-by-side comparison of 2 or more data series across categories to visualize relative magnitudes, performance, and trends at a glance. Ideal for market size comparison, competitor performance analysis, quarterly or regional sales tracking, and data-driven business presentations.
-
How to Use
Modify bar heights to input actual data values and update legend and axis labels accordingly. Add key findings and insights in the text areas below the chart to enhance audience comprehension. The astronomy theme with cosmic background and star decorations provides visual cohesion throughout the presentation.
-
Recommended For
Recommended for marketing, sales, and strategy teams presenting quarterly performance reports, executive-level competitive analysis, investor pitches on market positioning, and consulting reports requiring comparative analysis sections. Suitable for any business presentation requiring data-driven decision-making visualization.
-
Slide Structure
2-slide set. Each slide features title area at top, 6-category × 2-series grouped vertical bar chart in center, and 2 text boxes for descriptive content at bottom. Teal and pink color differentiation provides clear visual distinction between data series.
Related Products
-

Analyzing 2 Comparison Graphs - Slides for Deriving Competitive Advantage
#Market and Competitor Analysis #Graph #Competitor Analysis
-

Infographic Slide Highlighting Visualized Data – Modern Design
#Market and Competitor Analysis #Graph #Competitor Analysis
-

Market Trend Visualized with Vertical Bar Graph
#Market and Competitor Analysis #Graph #Competitor Analysis
-

PC Mockup & Column Bundle Graph
#Market and Competitor Analysis #Graph #Other
