Space Observation Analysis Broken Line Graph – Market and Competitive Analysis
RJ0700002_7
- Last Update 07/21/2025
- File Size 0.3MB
- # of Slides 2
- File Format PPTX
- Slide Ratio 16:9
- Color
Keywords
About the Product
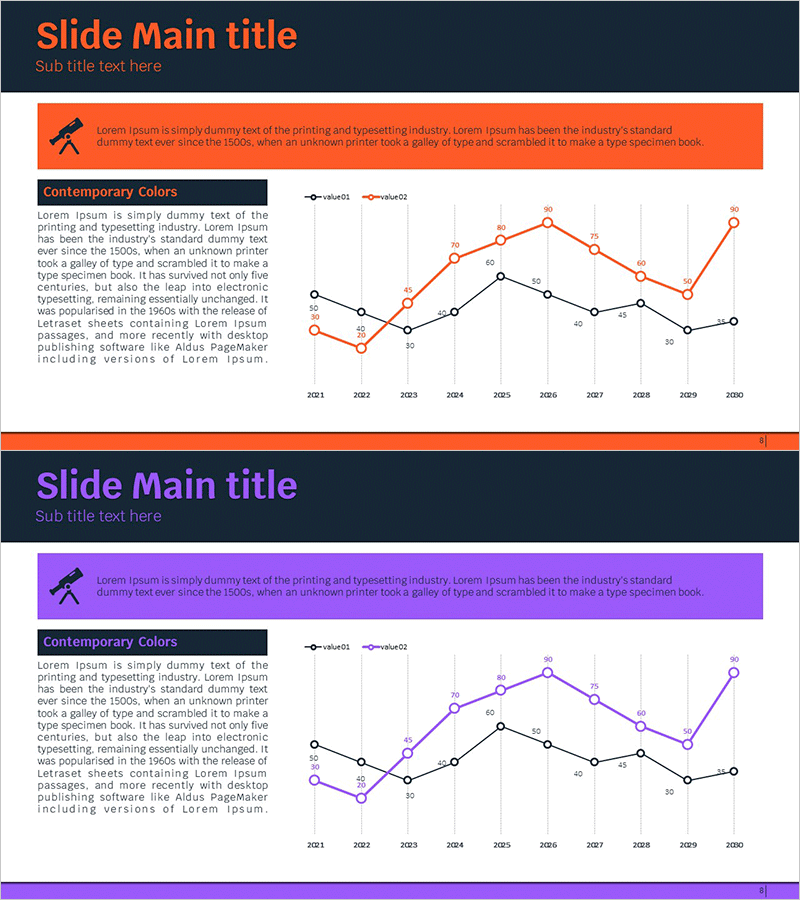
A dual-series line chart PowerPoint slide that visualizes data changes across two comparable metrics. The dark background features orange and black line series tracking market dynamics from 2021 to 2030, with numeric labels at each data point for precise value communication. This slide template is ideal for competitive analysis, growth rate comparisons, and sales trend presentations. The 16:9 widescreen format with 2-slide composition adapts seamlessly to various presentation environments and business reporting scenarios.
Usage Points
-
Main Usage
Compares two or more data series across a time period in business presentations. Ideal for market growth rates, competitor performance benchmarking, sales trends, customer satisfaction metrics, and any scenario requiring side-by-side trend analysis.
-
How to Use
Click on data points to edit values; the chart updates automatically. Customize line colors, thickness, and marker styles to match brand guidelines. Edit legend labels, axis titles, and background colors using PowerPoint's built-in chart tools without requiring external software.
-
Recommended For
Strategy teams, marketing departments, sales divisions, and finance teams presenting quarterly or annual results, executive reports, investor presentations, and market research findings. Particularly effective when comparing performance across two departments, products, or geographic regions.
-
Slide Structure
Dark background with orange and black dual-series line chart spanning 2021–2030 (10 data points). Each point displays numeric labels for clarity. Left side contains descriptive text area; right side features the chart visualization. Layout balances information density with visual clarity.
Related Products
-

Competitor Progress Comparison Analysis Graph – Essential Tool for Market Analysis
#Market and Competitor Analysis #Graph #Competitor Analysis
-

Default Line Graph for Market & Competitor Analysis – Competitive Advantage
#Market and Competitor Analysis #Graph #Competitor Analysis
-

Curved Graphs and Analysis Messages – Market and Competitor Analysis
#Market and Competitor Analysis #Graph #Competitor Analysis
-

Competitor Analysis Broken Line Graph
#Market and Competitor Analysis #Graph #Competitor Analysis
