Orange Green Growth Graph Analysis – Market Competitive Advantage
RJ0600110_11
- Last Update 07/20/2025
- File Size 5.7MB
- # of Slides 2
- File Format PPTX
- Slide Ratio 16:9
- Color
Keywords
- #Content-Based Slides
- #Design-Based Slides
- #Business Strategy
- #Market and Competitor Analysis
- #Graph
- #Financial Outlook & Expected Impact
- #Competitive Advantage
- #Column
- #Grouped Column
- #16:9
- #grouped bar chart PowerPoint
- #3-series data comparison slide
- #growth trend PowerPoint template
- #multi-series bar graph slide
- #how to create grouped bar chart in PowerPoint
About the Product
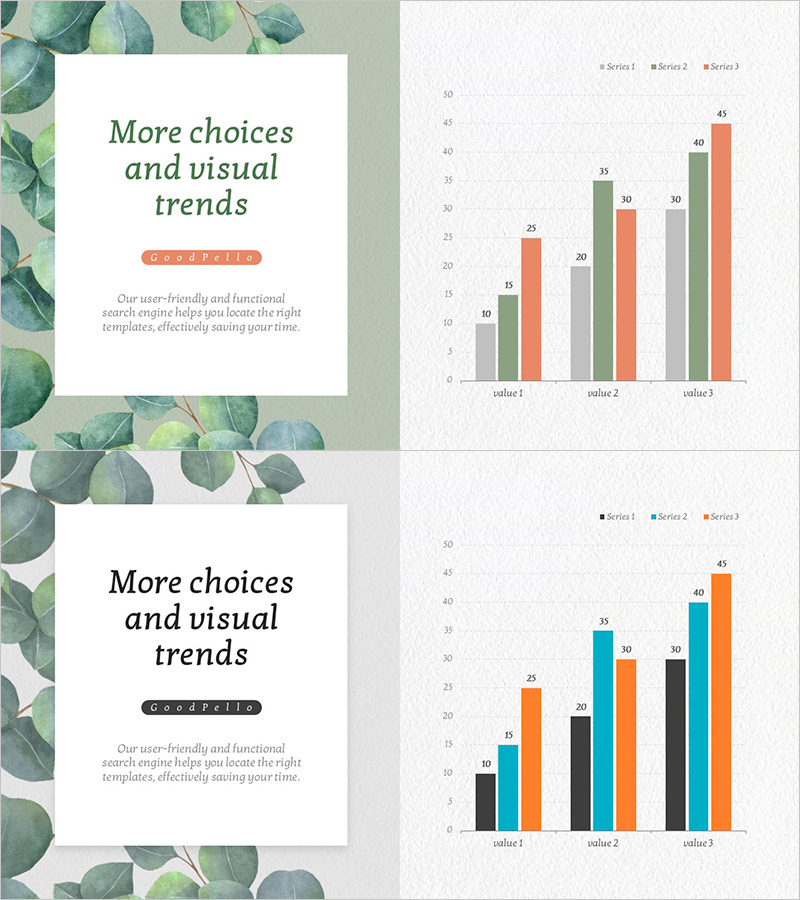
A grouped bar chart PowerPoint slide featuring orange, green, and gray color combinations across 2 slides. This presentation template displays the same data structure in different color schemes, allowing you to choose based on your presentation context and design preference. Each slide compares 3 data series across 3 values, making it ideal for market analysis, growth forecasting, and competitive advantage presentations. The 16:9 widescreen PPTX format ensures compatibility with all presentation environments and is ready to download and customize immediately.
Usage Points
-
Main Usage
This slide is designed to visualize multi-series numerical data comparisons effectively. It's ideal for presenting competitive analysis against rivals, quarterly or annual performance trends in business strategy presentations, and projected revenue forecasts in investor pitches where quantitative evidence is essential.
-
How to Use
Simply edit the bar heights and numerical labels with your own data. The 2-slide format allows you to use the first slide for primary comparison data and the second for detailed analysis or alternative metrics. You can maintain the existing color scheme or modify it to match your corporate brand colors.
-
Recommended For
Executives, finance teams, marketing departments, and strategic planning teams benefit from this template when presenting quarterly results, market analysis, and competitive positioning. It's particularly effective for board presentations, investor relations meetings, and strategy planning sessions where data-driven credibility is paramount.
-
Slide Structure
Both slides feature identical layouts with 3 values (value 1, 2, 3) and 3 data series (Series 1, 2, 3) displayed as grouped bars side by side. Slide 1 uses orange, gray, and coral tones; Slide 2 uses black, teal, and orange. Numerical labels appear above each bar for precise value comparison.
Related Products
-

Business Analysis Chart – Visualizing Competitive Advantage
#Market and Competitor Analysis #Graph #Other
-

Internet Game Usage Graph – Performance and Competitive Advantage
#Business Strategy #Market and Competitor Analysis #Graph
-

Market Competition: Deep Dive into Top 3 Firms
#Market and Competitor Analysis #Graph #Competitor Analysis
-

Chart of Change in Sales by Country – Market Analysis and Competitive Advantage
#Market and Competitor Analysis #Graph #Other
